Category Archives: Visualization

Visualizing Activities

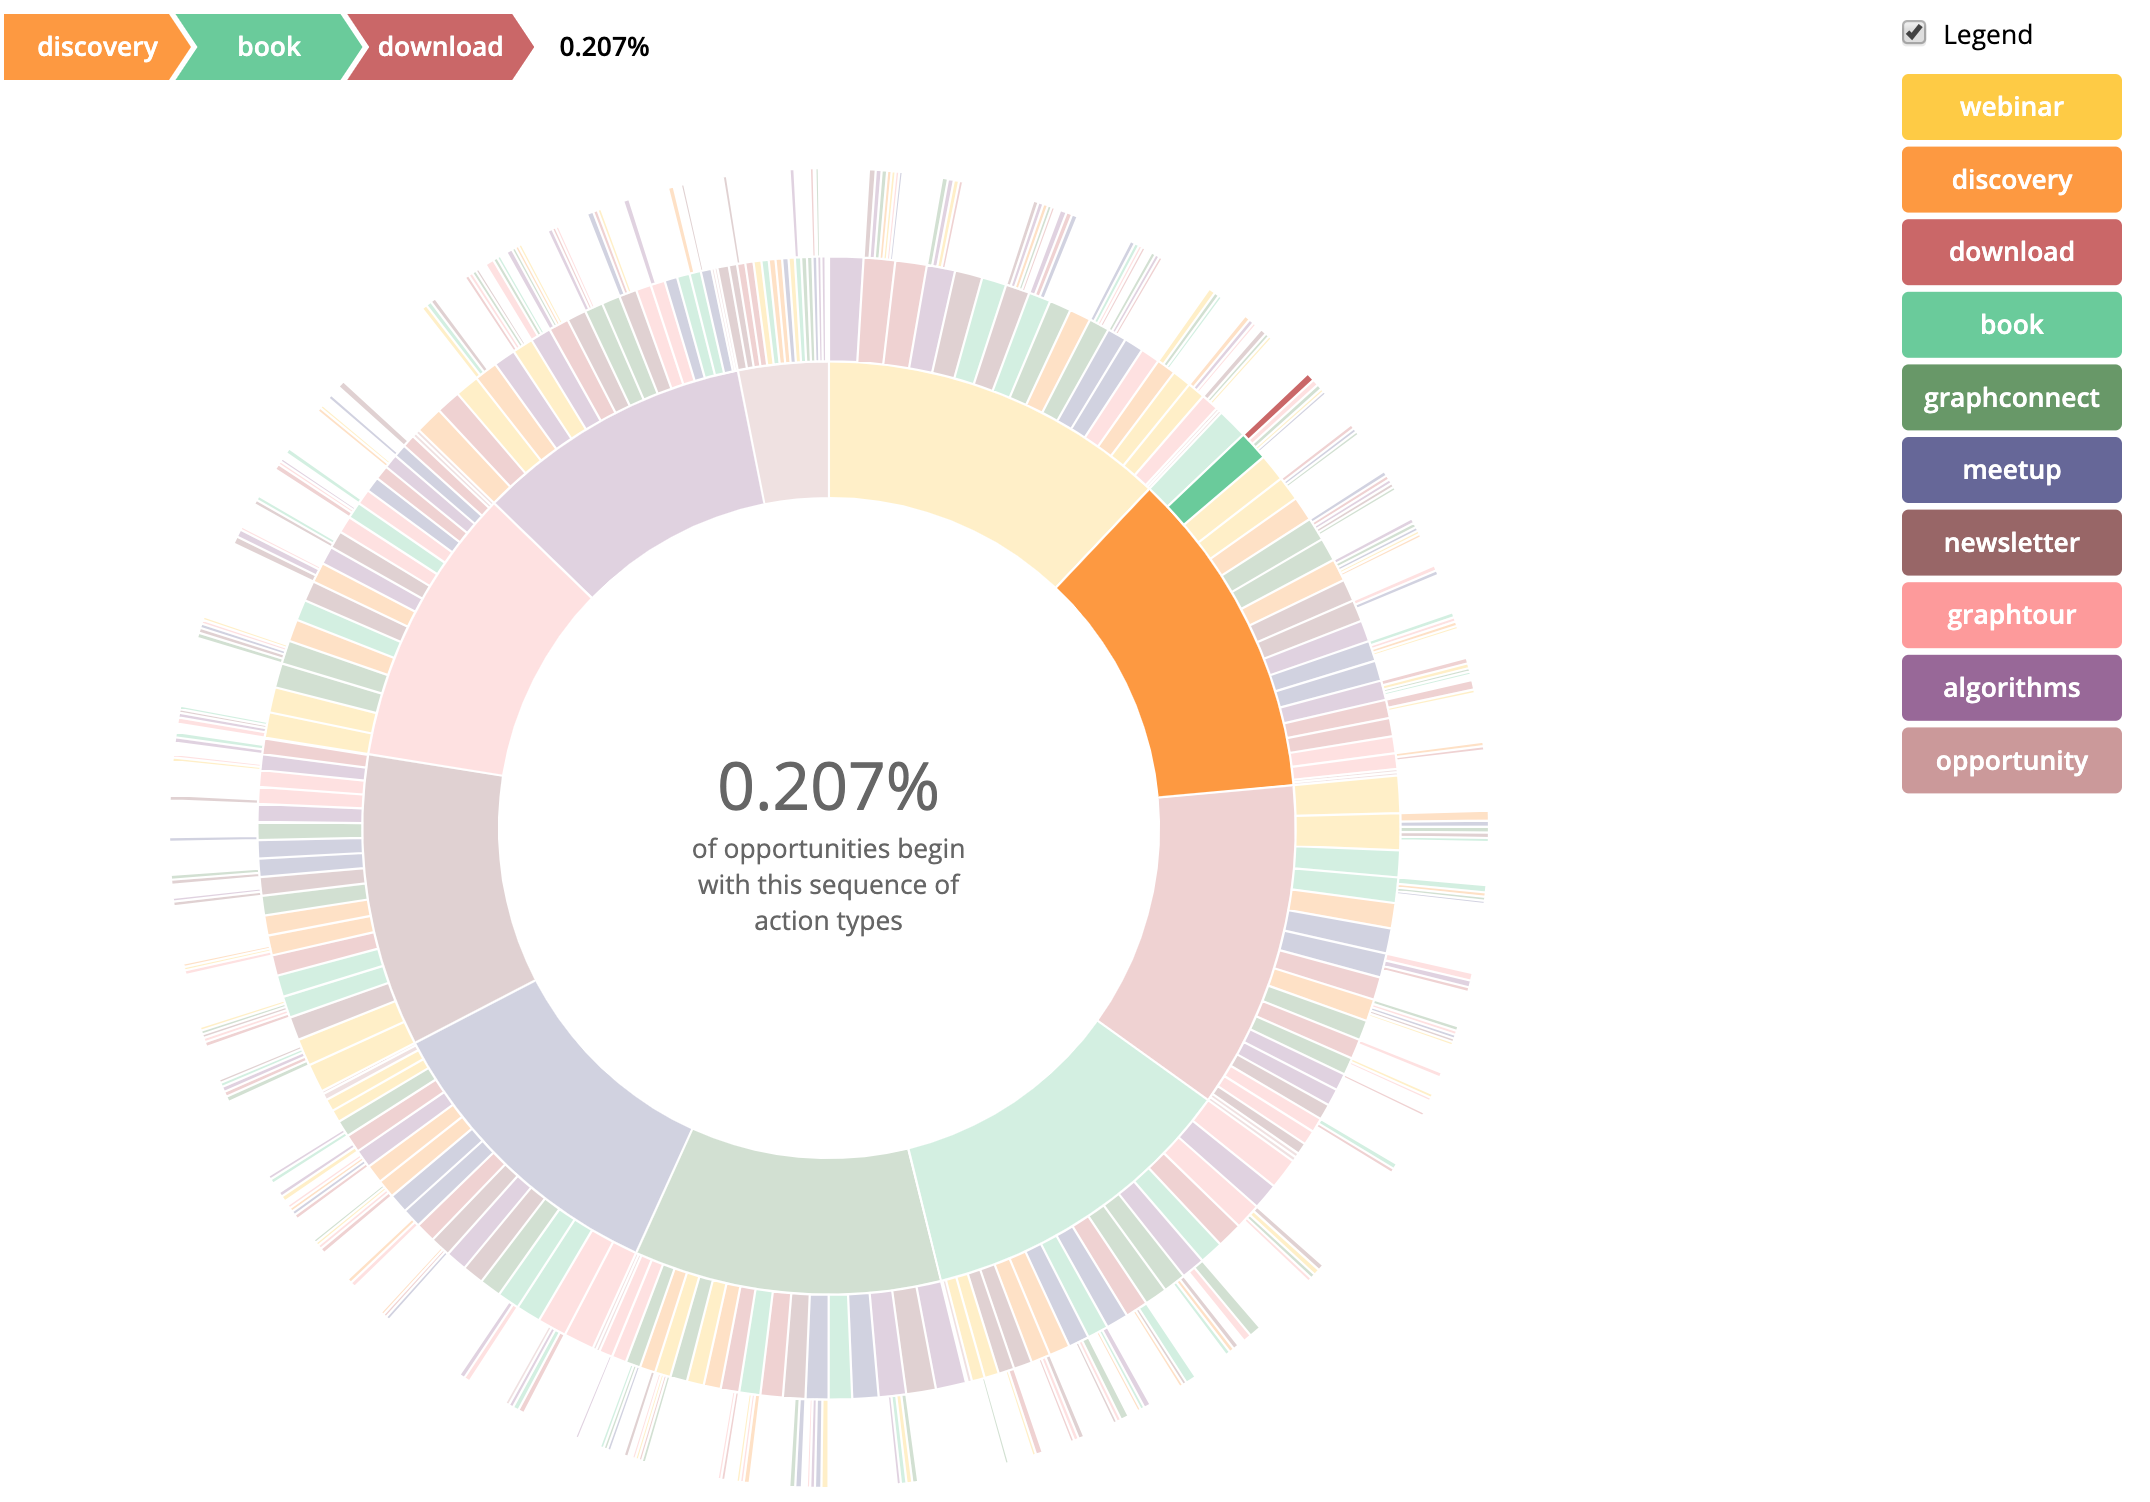
A few weeks ago I blogged about Activities in Neo4j, and we ended up with a way to recommend an activity to a user based on what sequence of activities they had done in the past. We also had a list of common sequences of activities, but they were a bit hard to digest. Today I’m going to show you how to visualize them so they make more sense.

Continue reading

Tagged , , , , , , , ,

Our own Multi-Model Database – Part 5

shitty5

In part 4 I promised metrics and a shell, so that’s what we’ll tackle today. We are lucky that the Metrics library can be plugged into Jooby without much effort… and double lucky that the Crash library can also be plugged into Jooby without much effort. This is what we are all about here because we’re a bunch of lazy, impatient developers who are ignorant of the limits of our capabilities and who would rather reuse open source code instead of falling victim to the “Not Invented Here” syndrome and do everything from scratch.
Continue reading

Tagged , , , , , , , ,

Tracking User Paths in an IVR with Neo4j

I started my software development career writing applications for a Call Center at a small bank in Florida. I remember the bank had purchased whatever the “Cadillac” of Interactive Voice Response (IVR) systems was then for some crazy amount of money. Today you can build an IVR overnight using Twilio.

twilio

When you sign up with Twilio, you get to choose your phone number (more or less). For example, I picked +1 (636) 451-7411, which spells out +1 (neo) 4j1-7411. If you were to call this number right now (assuming I have not run out of Twilio credits) you’ll connect to my IVR.
Continue reading

Tagged , , , , ,

The Last Mile

Last-Mile

The “last mile” is a term used in the telecommunications industry that refers to delivering connectivity to the customers that will actually be using the system. In the sense of Graph Databases, it refers to how well the end user can extract value and insight from the graph. We’ve already seen an example of this concept with Graph Search, allowing a user to express their requests in natural language. Today we’ll see another example. We’ll be taking advantage of the features of Neo4j 2.0 to make this work, so be sure to have read the previous post on the matter.

We’re going to be using VisualSearch.js made by Samuel Clay of NewsBlur. VisualSearch.js enhances ordinary search boxes with the ability to autocomplete faceted search queries. It is quite easy to customize and there is an annotated walkthrough of the options available. You can see what it does in the image below, or click it to try their demo.

Continue reading

Tagged , , , , , , ,

Visualizing the news with Vivagraph.js

neo_news

Today I want to introduce you to VivaGraphJS – a JavaScript Graph Drawing Library made by Andrei Kashcha of Yasiv. It supports rendering graphs using WebGL, SVG or CSS formats and currently supports a force directed layout. The Library provides an API which tracks graph changes and reflect changes on the rendering surface which makes it fantastic for graph exploration.

Today we will be integrating it with Neo4j and the Alchemy API.

Continue reading

Tagged , , , , , , ,

CrunchBase on Neo4j

NeoTechnology was featured on TechCrunch after raising a Series B round, and it has an entry on CrunchBase. If you look at CrunchBase closely you’ll notice it’s a graph. Who invested in what, who co-invested, what are the common investment themes between investors, how are companies connected by board members, etc. These are questions we can ask of the graph and are well suited for graph databases.
Continue reading

Tagged , , , , , , ,

Hubway Data Visualization Challenge with Neo4j

Michael Hunger imported the Hubway Challenge dataset into a Neo4j graph database, and made it available for us to play with.
Continue reading

Tagged , , , , , , ,

NeoSocial: Connecting to Facebook with Neo4j

Social applications and Graph Databases go together like peanut butter and jelly. I’m going to walk you through the steps of building an application that connects to Facebook, pulls your friends and likes data and visualizes it. I plan on making a video of me coding it one line at a time, but for now let’s just focus on the main elements.
Continue reading

Tagged , , , , , , , ,

Key Players

In the late 90s Michael Jordan, Scottie Pippen, and Dennis Rodman of the Chicago Bulls dominated the basketball court. They were the key players of the Chicago Bulls, and dominated the NBA offensively and defensively. When exploring a social network you’ll want to find who the key players are for a variety of reasons:

Disrupt: Who should be removed from the network to disrupt it?
Protect: Who should be protected in order to keep the network functioning?
Influence: Who should be influenced in order to change social opinion?
Learn: Who should be questioned in order to know what is going on?
Redirect: Who should be moved to alter social flows?
Continue reading

Tagged , ,

Using Three.js with Neo4j

Last week we saw Sigma.js, and as promised here is a graph visualization with Three.js and Neo4j. Three.js is a lightweight 3D library, written by Mr. Doob and a small army of contributors.

The things you can do with Three.js are amazing, and my little demo here doesn’t give it justice, but nonetheless I’ll show you how to build it.
Continue reading

Tagged , , , , , ,