Hey HackerNews, let me just drop my mixtape, checkout my soundcloud and “Death Row” is the label that pays me.
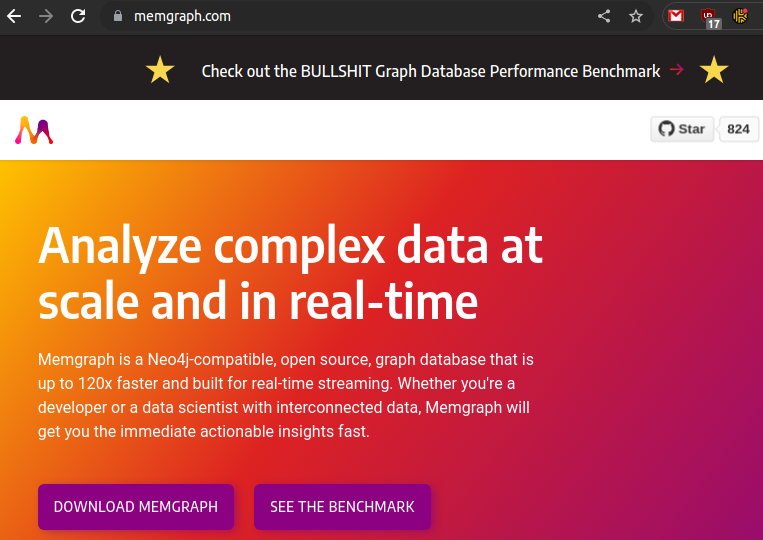
How is the Graph Database category supposed to grow when vendors keep spouting off complete bullshit? I wrote a bit about the ridiculous benchmark Memgraph published last month hoping they would do the right thing and make an attempt at a real analysis. Instead these clowns put it on a banner on top of their home page. So let’s tear into it.
At first I considered replicating it using their own repository, but it’s about 2000 lines of Python and I don’t know Python. Worse still, the work is under a “Business Source License” which states:
“Authorised Purpose” means any of the following, provided always that (a) you do not embed or otherwise distribute the Licensed Work to third parties; and (b) you do not provide third parties direct access to operate or control the Licensed Work as a standalone solution or service:
1…
2….
3. using the Licensed Work to create a work or solution which competes (or might reasonably be expected to compete) with the Licensed Work.
https://github.com/memgraph/memgraph/blob/master/licenses/BSL.txt
IANAL, but that sounds like you aren’t allowed to use their benchmark code if you provide a competing solution. Which means the other database vendors can’t actually use this anyway. Why would they do this? Because it’s a bullshit benchmark and they don’t actually want anybody looking too deeply at it.
So I decided to just do a simple project using Gatling. An industry standard tool to test performance. Why doesn’t everybody just do that instead of creating their own weird thing that is probably full of problems? Oh right, because everyone produces bullshit benchmarks.
They decided to provide the data not in a CSV file like a normal human being would, but instead in a giant cypher file performing individual transactions for each node and each relationship created. Not batches of transactions… but rather painful, individual, one at a time transactions one point 8 million times. So instead of the import taking 2 minutes, it takes hours. Why would they do this? I keep forgetting… because they don’t actually want anybody trying this.
Ok, what’s their hardware for the benchmark results?
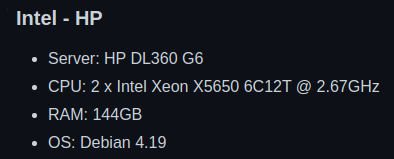
A G6? I’m feeling so fly like a G6. Those came out in 2009. I would go on ebay and buy a refurbished one for $50 bucks, but I don’t have a rack to put it in and no guarantee it won’t catch on fire the second I turn it on. I’ll just use my gaming pc with an Intel® Core™ i7-10700K CPU @ 3.80GHz × 8 cores. Debian 4.19… uh… they can’t mean that, they probably mean Debian 10 with Linux kernel 4.19. I’ll stick with Ubuntu 22.04 with Linux kernel 6.0.5.
Well use the medium dataset (which already takes hours to import the way they set it up) from a “hot engine”. Has anyone ever tried testing the performance of a sports car with a “cold engine”? No, because that’s stupid, so we won’t do that here. Alright the first 4 queries are:
Q1: MATCH (n:User) RETURN n.age, COUNT(*)
Q2: MATCH (n) RETURN count(n), count(n.age)
Q3: MATCH (n:User) WHERE n.age >= 18 RETURN n.age, COUNT(*)
Q4: MATCH (n) RETURN min(n.age), max(n.age), avg(n.age)
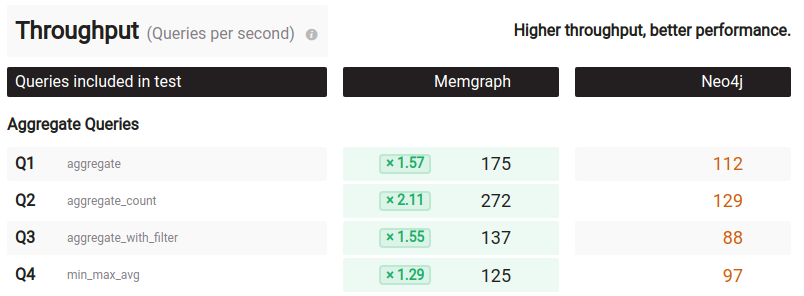
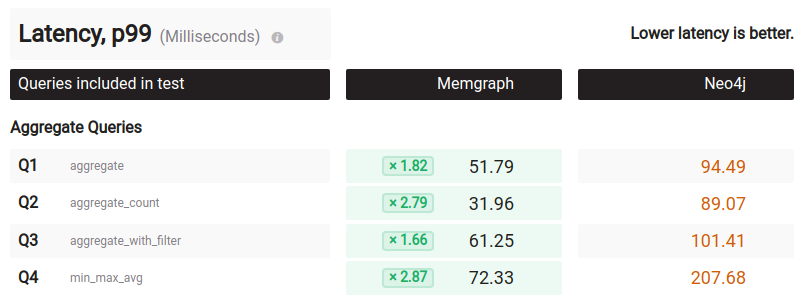
Those are not “graphy” queries at all, why are they in a graph database benchmark? Ok, whatever. Let’s take a look at the raw data for the first query [neo4j and memgraph]:
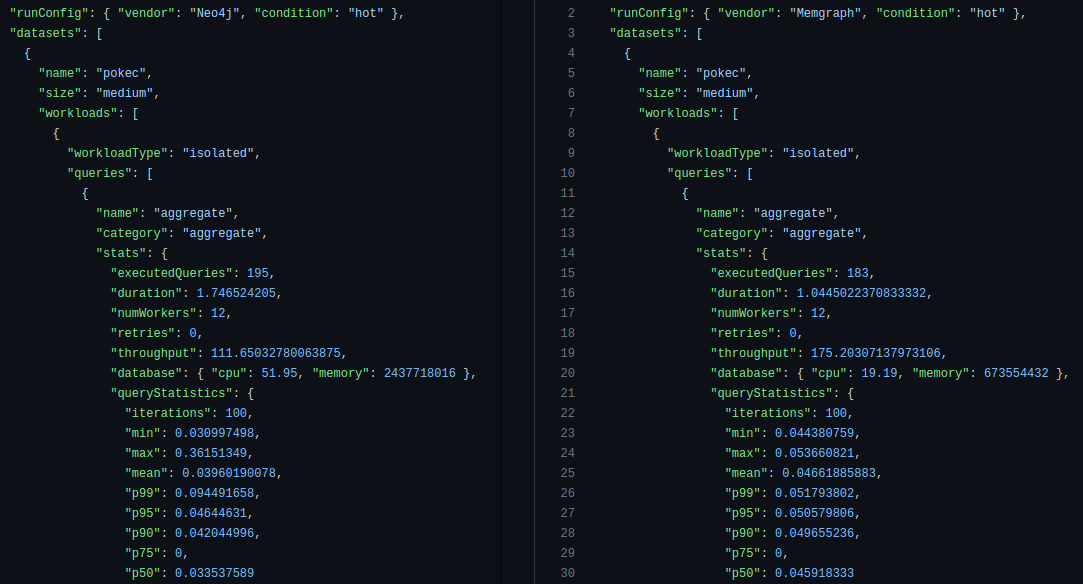
On the left we have Neo4j, on the right we have Memgraph. Neo4j executed the query 195 times, taking 1.75 seconds and Memgraph 183 times taking 1.04 seconds. Why would you execute the query for different amount of times or different durations of time? That makes no sense. In a proper benchmark you would run each and every query for at least 60 seconds, preferably more and then compare. They do a little division and come up with 112 requests per second for Neo4j and 175 for Memgraph:
However, the CPUs of both systems were not at 100% meaning they were not fully utilized. The query statistics part is also weird. “iterations”:100... wait a minute, no they didn’t… they did not take 100 additional queries with a single worker separate from the queries they used for throughput and generate “p” latencies in the most idiotic way possible. Yes they did. But of course they did:
    for i in range(0, iteration):
        ret = client.execute(queries=[query_list[i]], num_workers=1)
        latency.append(ret[0]["duration"])
    latency.sort()
    query_stats = {
        "iterations": iteration,
        "min": latency[0],
        "max": latency[iteration - 1],
        "mean": statistics.mean(latency),
        "p99": latency[math.floor(iteration * 0.99) - 1],
        "p95": latency[math.floor(iteration * 0.95) - 1],
        "p90": latency[math.floor(iteration * 0.90) - 1],
        "p75": latency[math.floor(iteration * 0.75) - 1],
        "p50": latency[math.floor(iteration * 0.50) - 1],
    }
You know what’s also weird? They reported the p99 of only 100 queries which could be high for any number of reasons, but not the mean latency. Why not? Because in the mean latency Neo4j comes in at 39.6ms vs 46.6ms for Memgraph. Neo4j is actually faster if we look at the other metrics. The p95, p90, p50 and min are all faster for Neo4j. Talk about an egg on your face.

At this point I haven’t even ran a single of my own tests and I can dismiss this benchmark as Gigli bad. Ok, let’s try running query 1 for 60 seconds using 8 workers since I only have 8 cores vs their 12 and see what Gatling tells us:
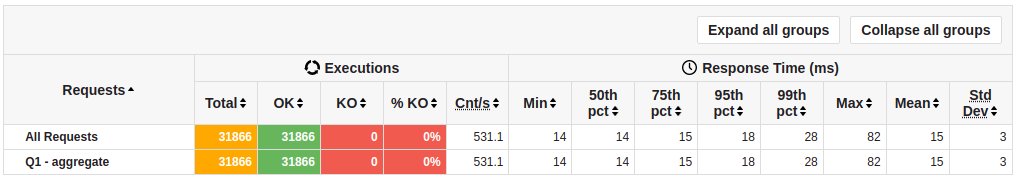
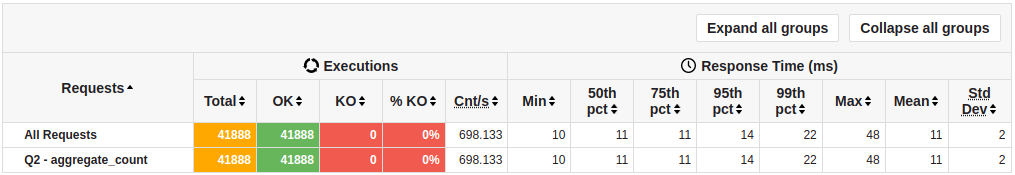
Instead of 112 queries per second, I get 531q/s. Instead of a p99 latency of 94.49ms, I get 28ms with a min, mean, p50, p75 and p95 of 14ms to 18ms. Alright, what about query 2? Same story.
Let’s see the rest:
                        Requests       Response Time (ms)
                        Total   Cnt/s  Min 50th 75th 95th 99th   Max Mean
Q1 - aggregate          31866   531.1   14  14   15   18    28    82   15
Q2 - aggregate_count    41888   698.133 10  11   11   14    22    48   11
Q3 - aggregate_with_f…  30820   505.246 14  15   15   18    28    95   16
Q4 - min_max_avg        31763   529.383 14  14   15   19    28    81   15
Q5 - expansion_1       615698 10093.41   0   1    1    1     2    90    1
Q6 - expansion_1_with… 615168 10084.721  0   1    1    1     2    64    1
Q7 - expansion_2        57683   945.623  0   2    7   41    81   583    8
Q8 - expansion_2_with… 109390  1793.279  0   1    4   17    41   252    4
Q9 - expansion_3         3027    49.623  0  95  233  552   733  1028  159
Q10 - expansion_3_wit…   4832    79.213  0  59  148  328   479   803   99
Q11 - expansion_4         226     3.054  1 888 2157 9194 22886 25890 2261
Q12 - expansion_4_wit…    247     3.087  1 679 2026 8584 21703 24169 2138
Q13 - neighbours_2      56106   919.77   0   2    8   42    84   367    8
Q14 - neighbours_2_wit 105232  1725.115  0   1    5   18    43   328    4
Q15 - neighbours_2_wi…  32580   534.098  0   5   15   68   121   385   15
Q16 - neighbours_2_wi…  60791   996.574  0   4   10   27    61   414    8
Q17 - pattern_cycle    523845  8587.623  0   1    1    2     3    82    1
Q18 - pattern_long     602254  9873.016  0   1    1    1     2    31    1
Q19 - pattern_short    616306 10103.377  0   1    1    1     2    20    1
Q20 - single_edge_wri… 242302  3972.164  1   2    2    3     6    32    2
Q21 - single_vertex_w… 284782  4668.557  1   2    2    2     5    75    2
Q22 - single_vertex_p…   9646   158.131 39  49   51   58    71   139   49
Q23 - single_vertex_r… 614535 10074.344  0   1    1    1     2   109    1
Those numbers are wildly different than the numbers Memgraph calculated for Neo4j in their benchmark. Let’s see the breakdown:
                                   Neo4j
                        Memgraph   reported   mine  Winner     By
Q1 - aggregate               175        112    531   Neo4j     3.03*
Q2 - aggregate_count         272        129    698   Neo4j     2.56*
Q3 - aggregate_with_filter   137         88    505   Neo4j     3.68*
Q4 - min_max_avg             125         97    529   Neo4j     4.23*
Q5 - expansion_1           29648        517  10093   Memgraph  2.93
Q6 - exp_1_with_filter     31553        467  10085   Memgraph  3.12
Q7 - expansion_2            2164         30    946   Memgraph  2.29
Q8 - exp_3_with_filter      3603         61   1793   Memgraph  2.01
Q9 - expansion_3             134          7     50   Memgraph  2.68
Q10 - exp_3_with_filter      159         12     79   Memgraph  2.01
Q11 - expansion_4              4          1      3   Memgraph  1.33
Q12 - exp_4_with_filter        5          2      3   Memgraph  1.66
Q13 - neighbours_2          2171         59    920   Memgraph  2.36
Q14 - n2_with_filter         727         48   1725   Neo4j     2.37*
Q15 - n2_with_data          1286         43    534   Memgraph  2.40
Q16 - n2_w_data_and_filter  3453         83    997   Memgraph  3.46
Q17 - pattern_cycle        21718        371   8588   Memgraph  2.53
Q18 - pattern_long         33130       1127   9873   Memgraph  3.36
Q19 - pattern_short        36187       1508  10103   Memgraph  3.58
Q20 - single_edge_write    32211        337   3972   Memgraph  8.11
Q21 - single_vertex_write  35172        557   4669   Memgraph  7.53
Q22 - s_v_property_update    239        106    158   Memgraph  1.51
Q23 - single_vertex_read   36843       1841  10074   Memgraph  3.66
It looks like Neo4j is faster than Memgraph in the Aggregate queries by about 3 times. Memgraph is faster than Neo4j for the queries they selected by about 2-3x except for query 14 where Neo4j plays the Uno Reverse card. I checked it multiple times, it is correct.
So there you have it folks. Memgraph is not up to 120 times faster than Neo4j… let’s fix their home page:

The source code and instructions for recreating this benchmark is on github.

Thanks a lot for your writeup. If I may ask: how do you connect from gatling to neo4j/memgraphdb?
Using the Neo4j http endpoint. Blog post updated with Gatling test file source code.
Thanks a lot!
Sweet breakdown thanks for taking the time here. My faith in publicized benchmarks has been pretty shaky lately so it’s nice to see I’m not alone.