Our last post was about a Triangle Count query. It referenced another blog post from Kuzu where they explained their use of a Multi Way Join Algorithm to count 41 million triangles in 1.62 seconds. Using only binary joins it would take them 51.17 seconds to achieve the same result. My attempts to run the query using Lua on Rage landed at 9.5 seconds one node at a time and 5.6 seconds using the batch queries. So that got me thinking, how about Neo4j?
How is the Graph Database category supposed to grow when vendors keep spouting off complete bullshit? I wrote a bit about the ridiculous benchmark Memgraph published last month hoping they would do the right thing and make an attempt at a real analysis. Instead these clowns put it on a banner on top of their home page. So let’s tear into it.
At first I considered replicating it using their own repository, but it’s about 2000 lines of Python and I don’t know Python. Worse still, the work is under a “Business Source License” which states:
In Cypher, we call any unbounded star query a “Death Star” query. You’ll recognize it if you see a star between two brackets in any part of the query:
-[*]-
the deadly pattern of a death star query
The “star” in Cypher means “keep going”, and when it is not bound by a path length -[*..3]- or relationship type(s) -[:KNOWS|FRIENDS*]- it tends to blow up Alderaaning servers. It’s hard to find a valid reason for this query, but its less deadly cousins are very important in graph workloads.
For example when looking at fraud, we may start with a Customer node and ask, which known Fraudulent nodes are within 4 hops away? A Customer HAS an Account that was ACCESSED by a Device that ACCESSED another Account that BELONGS_TO a known Fraudster. A Customer HAS a mailing Address that is very SIMILAR to an Address that BELONGS_TO a Business that is partially OWNED by a known Fraudster. These are just two out of many valid patterns in our graph. Graph databases were designed to handle these kind of queries. The trick is thatevery node KNOWS its relationships, every node KNOWS how it is connected.
If you’ve ever watched my talks about Neo4j, I tend to say we’re not very well optimized for Single Model queries where relationships aren’t considered. In fact, we’re kinda bad at it. Things got better when Composite Indexes were introduced, but we still have some limitations to deal with. Today we’re going to explore the issues and build our own faux “bitmap indexes” to get around this problem. Continue reading →
A few months ago I wrote up how to use the graph algorithms library to find fraud rings in bank data. The graph algorithms plugin has been a huge hit and received a promotion to a fully supported library with a team of developers, data scientists and product managers behind it. It was partially rewritten and given a fresh name. It is now called the Graph Data Science Library.
We’re going to give that fraud blog post a fresh look as well, change it to use the new library as well as throw more data at it. Please be sure you go back and read the original post right now so it’s fresh in your mind what we are going to do. Make sure you have the latest version of Neo4j Desktop running ( at least version 1.2.5 ), create a new graph with version 3.5.15 and install the plugin: Continue reading →
Neo4j 4.0 has officially launched and folks are very excited about some of the new features including multiple graphs and schema based security. But you should also be excited about some of the more “quality of life” improvements in the product. One we will talk about today is the upgrade that composite indexes received.
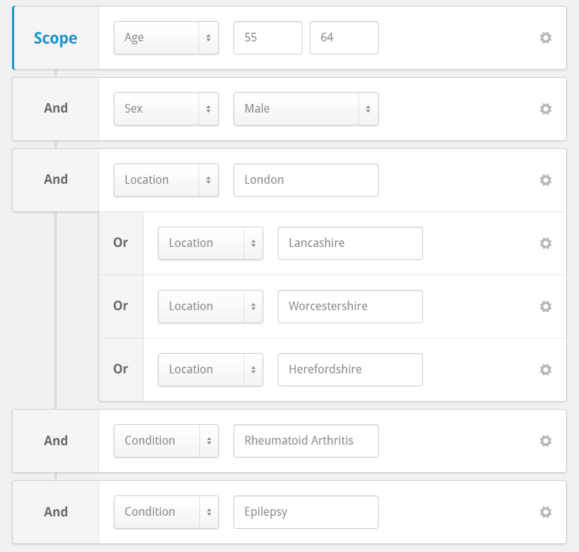
On Neo4j’s User Slack someone was having a bit of a hard time getting a query to return quickly. Their model had User Nodes and Transaction Nodes, and they wanted to get the last 25 transactions for a user. This particular user had millions of transactions and the query was taking forever. I’m going to show you how we can speed up the query and hopefully teach you a new modeling trick you can use in your graphs.
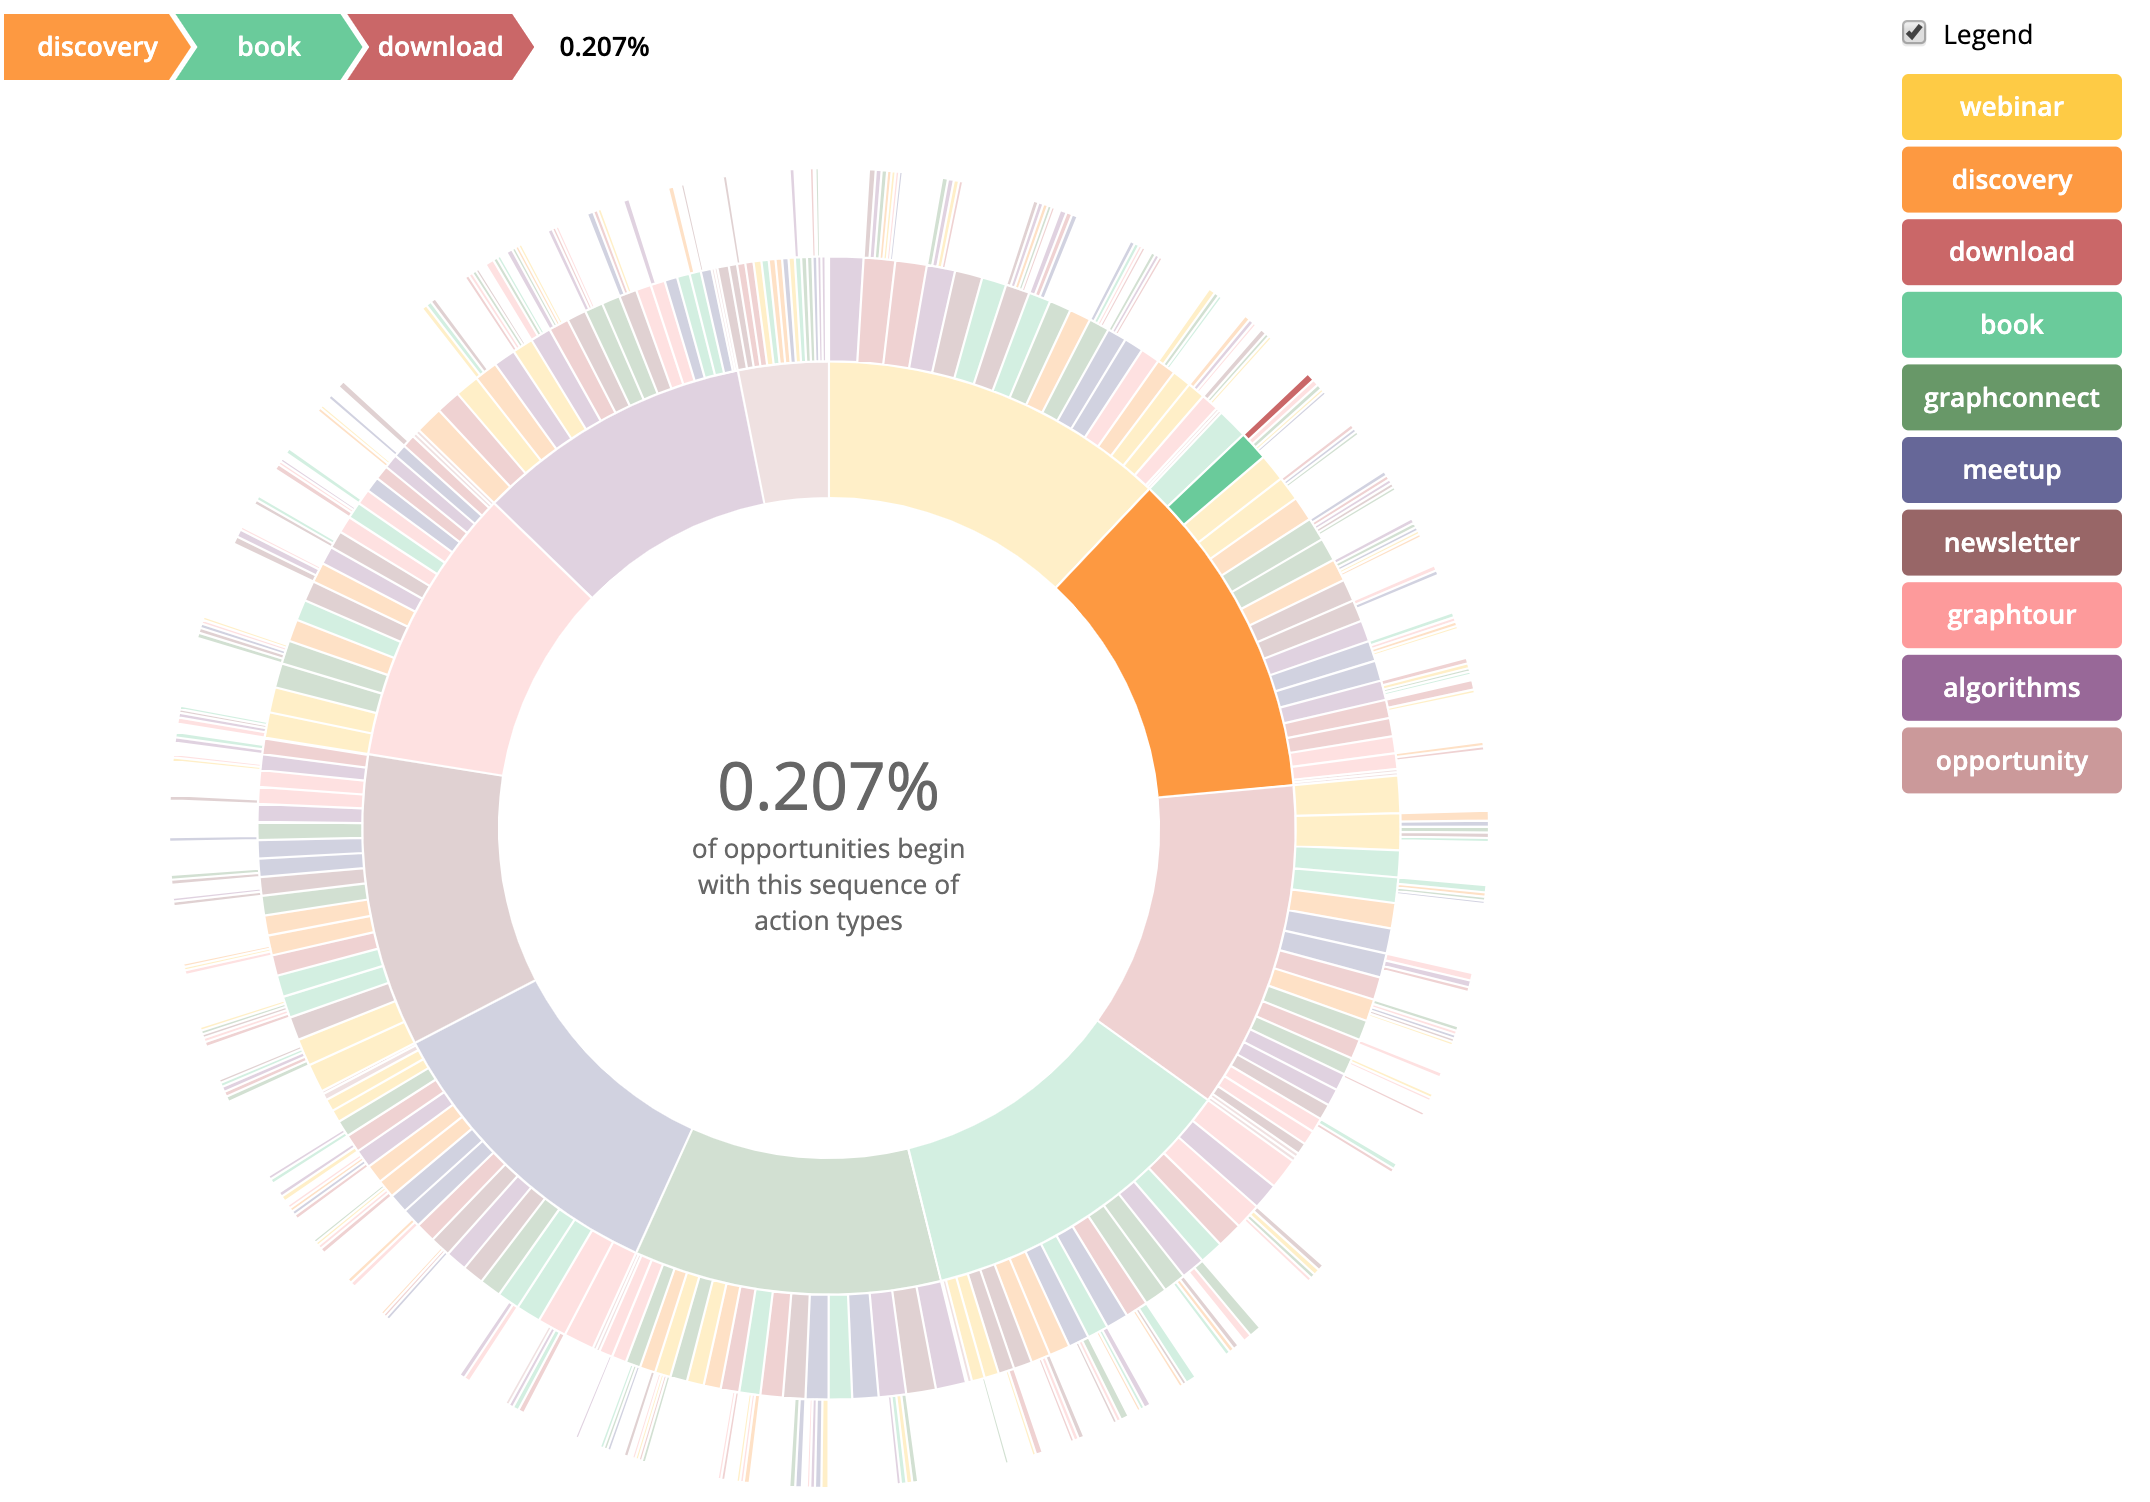
A few weeks ago I blogged about Activities in Neo4j, and we ended up with a way to recommend an activity to a user based on what sequence of activities they had done in the past. We also had a list of common sequences of activities, but they were a bit hard to digest. Today I’m going to show you how to visualize them so they make more sense.
The “footprints in the sand” poem is a story of a person walking on the beach with God and seeing two sets of footprints. The footprints represent the joys and sorrows of this persons life. During the worst of times the trail shows just one set of footprints. Confused as to why they would be abandoned at their time of need, God replies that “when you see only one set of footprints, it was then that I carried you”. It’s a touching poem, but a single set of footprints in the sand isn’t very graphy. Things get interesting when you superimpose the paths one over the other. We can then start to see where many paths converged and diverged, see how deep the footprints got at times, when they split where they went and where did they end up. Continue reading →
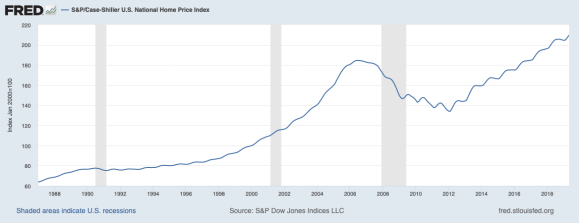
Is not that thing above. That’s a Chart, not a Graph. But anyway…Neo4j is designed to support the property graph model natively. There are a host of other technologies that can bolt-on a “graph layer” of some kind. However it doesn’t make them a graph database. It’s like adding a rear spoiler to a van, sure it may look cool… or ridiculous, but it won’t make it a race car. Don’t fall for it. If you need fast graph queries, use a real graph database. But today we won’t talk about that. Instead we’re going to talk about the real property graph… Continue reading →