A few weeks ago I blogged about Activities in Neo4j, and we ended up with a way to recommend an activity to a user based on what sequence of activities they had done in the past. We also had a list of common sequences of activities, but they were a bit hard to digest. Today I’m going to show you how to visualize them so they make more sense.
My initial reaction to a set of sequences is to use a Sankey diagram. Long time readers will have seen this used before on this blog post about tracking user paths in an IVR. That works well when we have a directed sequence of events that can’t backtrack or repeat. But in this case our users can do those things so the Sankey diagram will look like a mess.
Instead we are going to use a Sequences Sunburst diagram from Kerry Rodden. First we have to recall the query that gave us our sequences that eventually ended up in an opportunity:
MATCH path=(e:Email)-[:NEXT*1..3]->(a), path2=(a)-[:NEXT*]->()
WHERE ANY (x IN tail(nodes(path2)) WHERE x.type = "opportunity")
WITH [x IN tail(nodes(path)) | x.type] AS types
RETURN REDUCE(key = types[0], n IN types[1..] | key + "-" + n) AS key, COUNT(*)
ORDER BY key DESC
Run that again and this time, click on the “Export CSV” button.
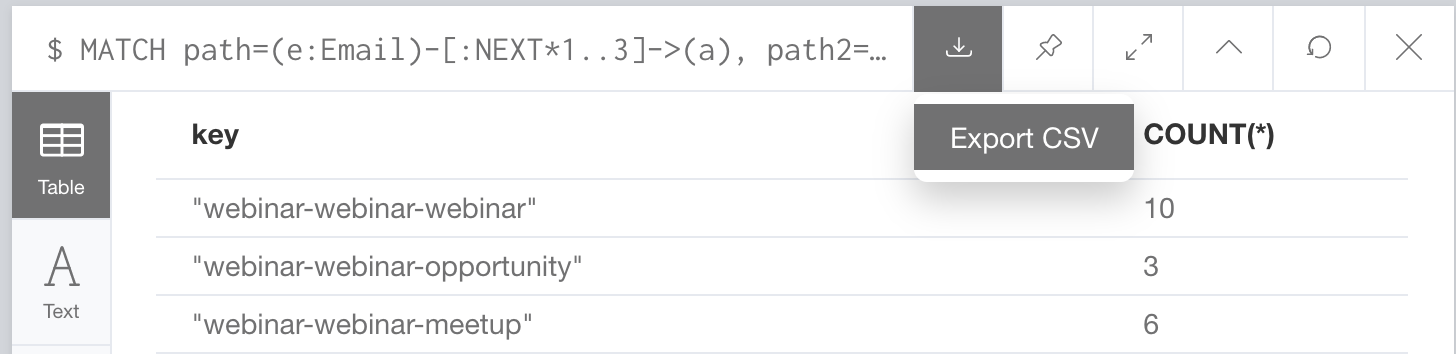
Once the file downloads, it should be called “export.csv” but rename it to “visit-sequences.csv”. Next we’ll grab the index.html, sequences.css and sequences.js from her example. If you open up the sequences.js file, you will see these lines:
d3.text("visit-sequences.csv", function(text) {
  var csv = d3.csvParseRows(text);
  var json = buildHierarchy(csv);
  createVisualization(json);
});
That’s where the visualization is getting its data. Of course you can rename the csv and edit this part of the javascript file to whatever you want. Ok, now we just need to run it. So put the csv file in the same directory as where you downloaded the other files and run this command:
python3 -m http.server 9000
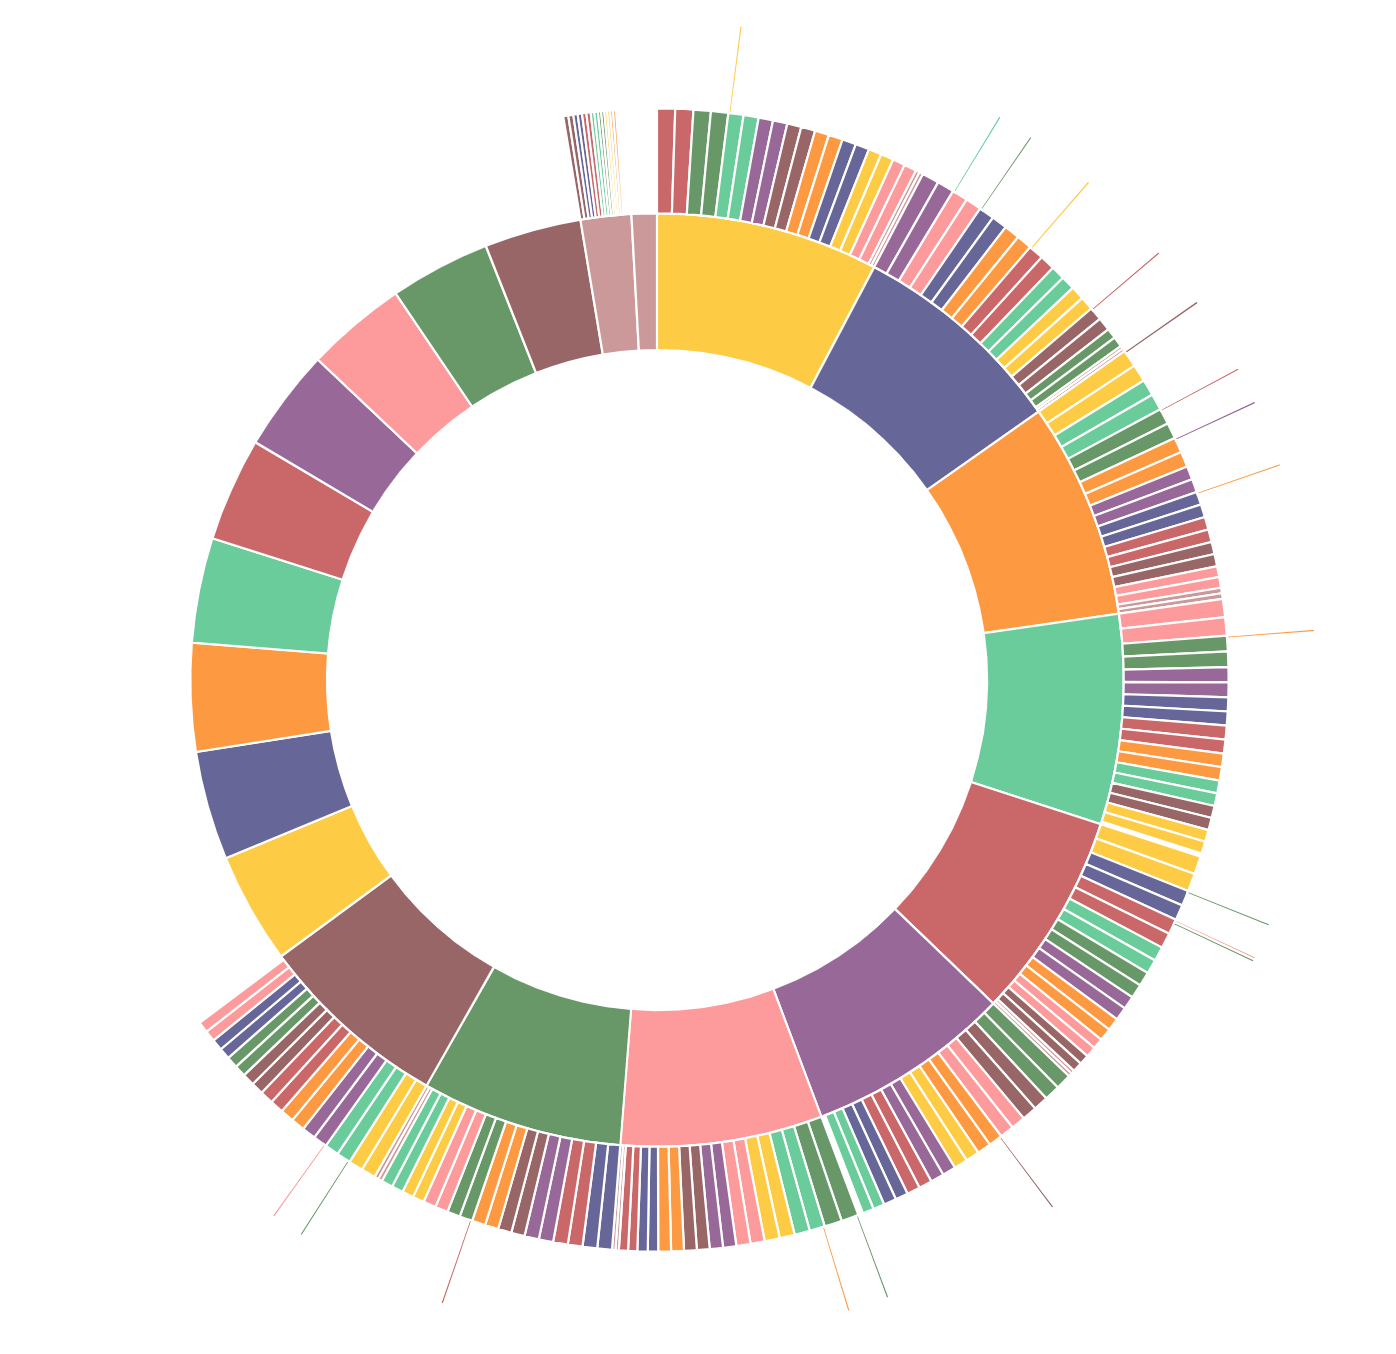
It will spin up a quick web server on port 9000 serving the files we downloaded… and look like this:

That’s not super helpful. We need to change the colors. Find this part in the javascript file:
// Mapping of step names to colors.
var colors = {
  "home": "#5687d1",
  "product": "#7b615c",
  "search": "#de783b",
  "account": "#6ab975",
  "other": "#a173d1",
  "end": "#bbbbbb"
};
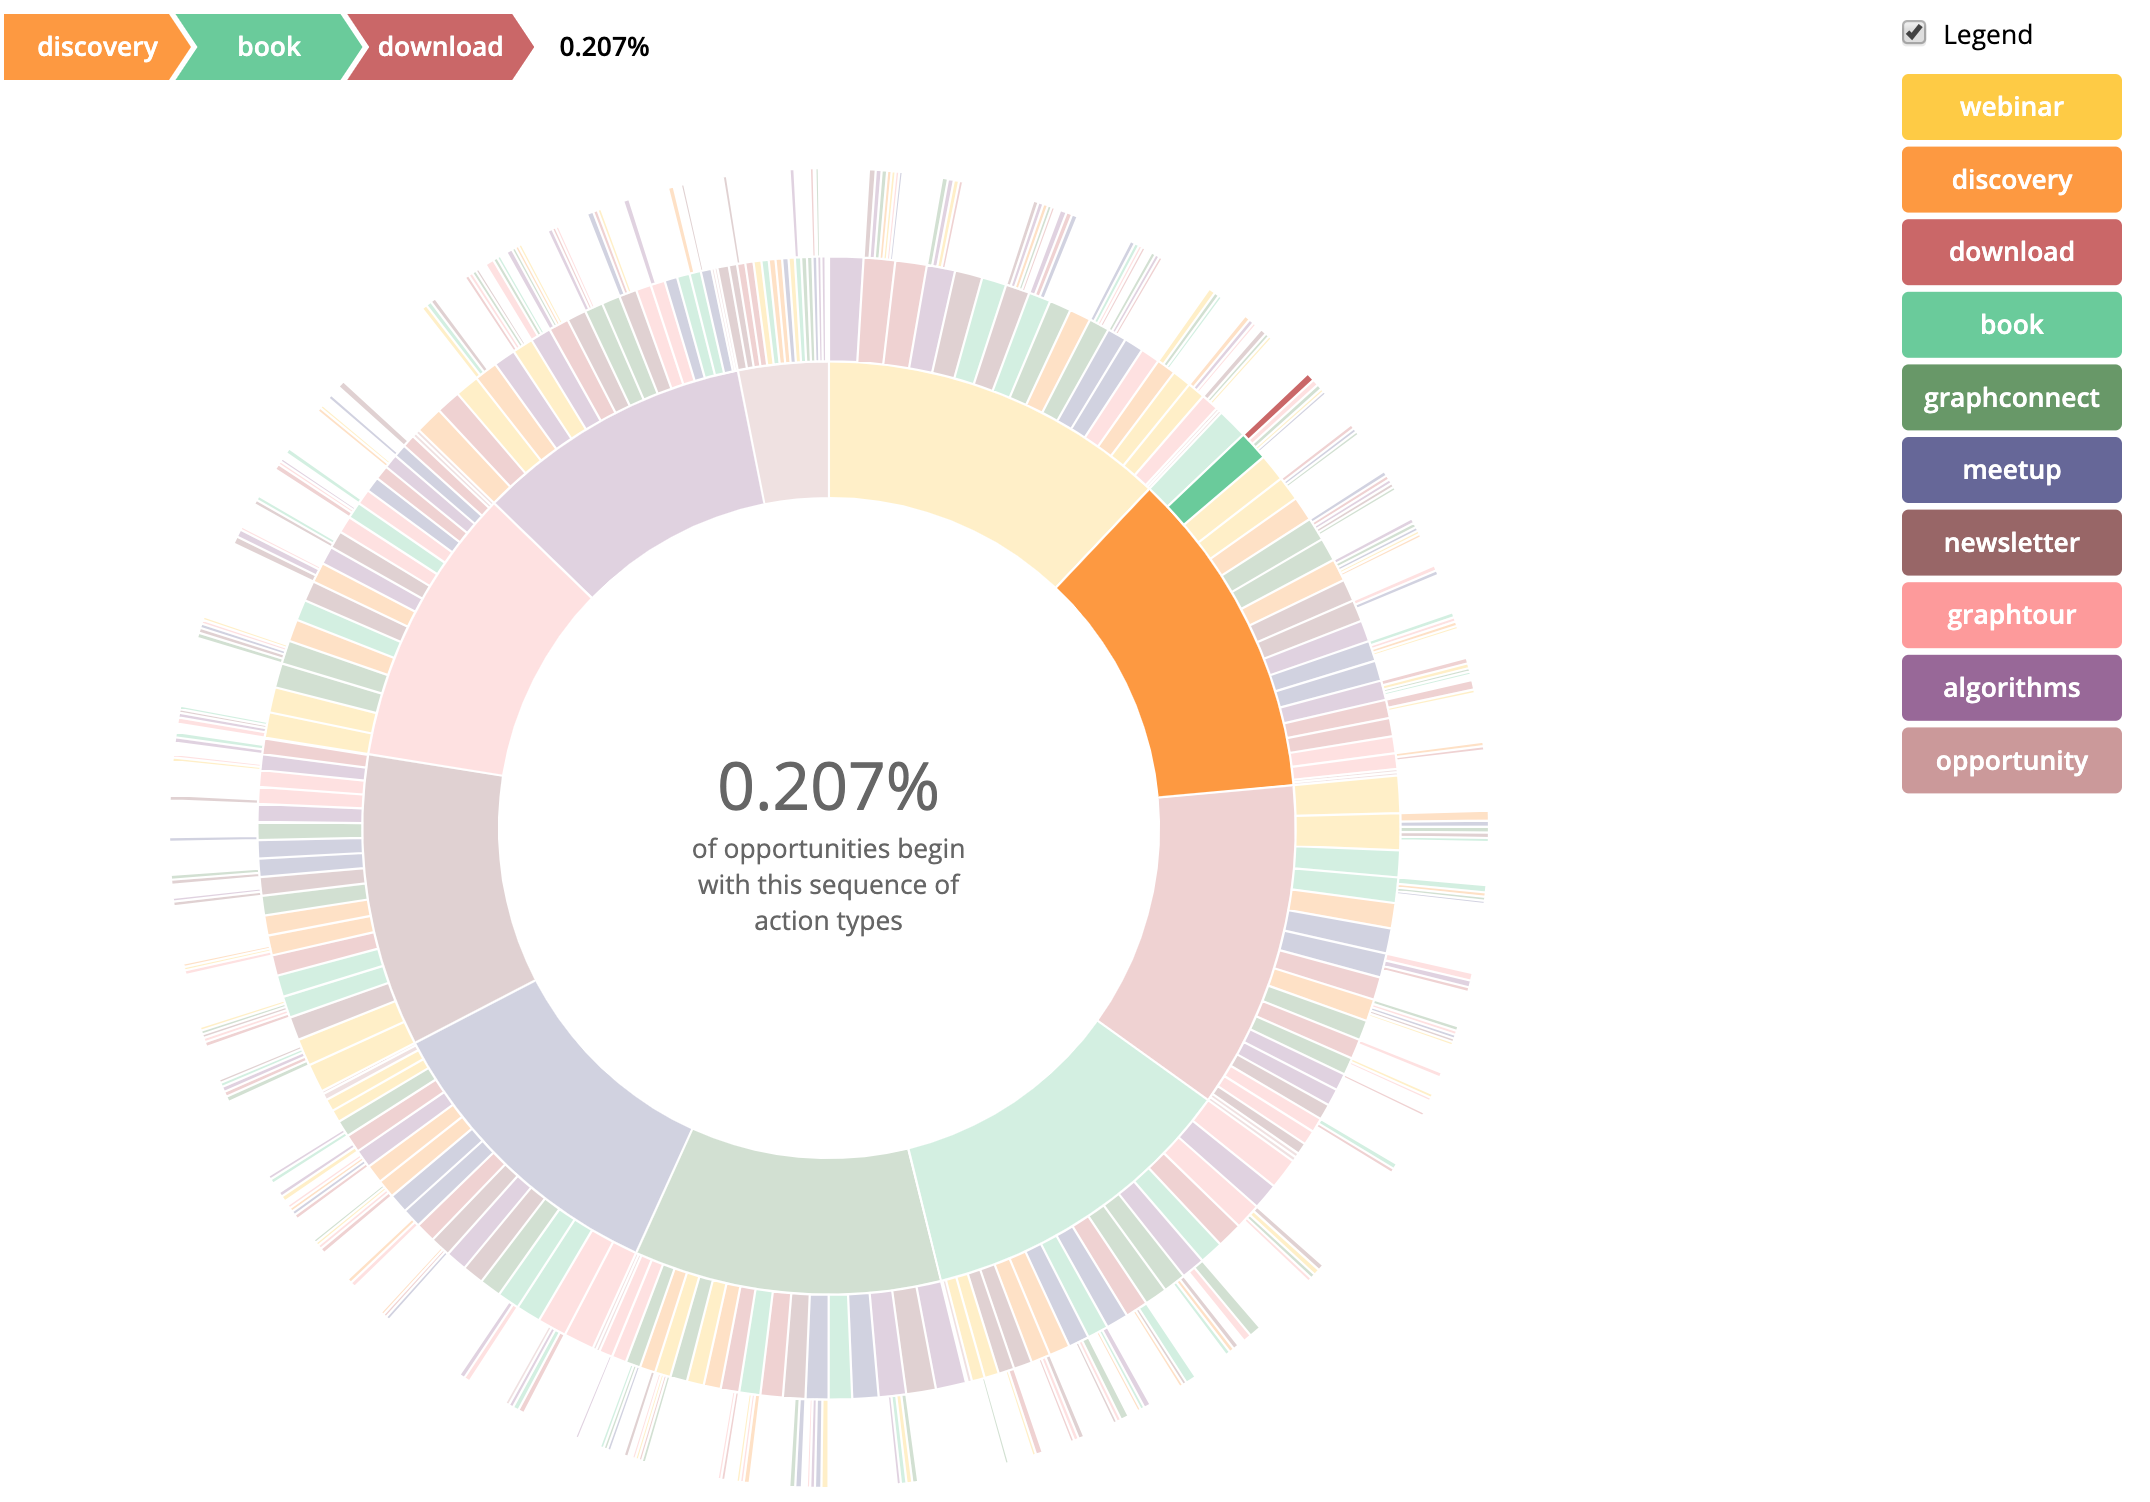
And change it to the following and hard refresh the page:
// Mapping of step names to colors.
var colors = {
	"webinar": "#FFCC33",
	"discovery": "#FF9933",
	"download": "#CC6666",
	"book": "#66CC99",
	"graphconnect": "#669966",
	"meetup": "#666699",
	"newsletter": "#996666",
	"graphtour": "#FF9999",
	"algorithms": "#996699",
	"opportunity": "#CC9999",
}
Now it looks better:

What else can we look at? How about all Activities:
MATCH path=(e:Email)-[:NEXT*1..3]->(a)
WITH [x IN tail(nodes(path)) | x.type] AS types
RETURN REDUCE(key = types[0], n IN types[1..] | key + "-" + n) AS key, COUNT(*)
ORDER BY key DESC
Activities in the month of January 2019:
MATCH path=(e:Email)-[:NEXT*1..3]->(a)
WHERE [x IN tail(nodes(path)) WHERE date("2019-01-01") <= x.date < date("2019-02-01")]
WITH [x IN tail(nodes(path)) | x.type] AS types
RETURN REDUCE(key = types[0], n IN types[1..] | key + "-" + n) AS key, COUNT(*)
ORDER BY key DESC
Activities for the cohort of Users that joined in February 2019. Here we are using “head(tail(nodes(path)))” to pinpoint the first activity the user performed. Since the path starts with the user, we need to get the tail of it, and then we need the first element of that path which is the “head” of the path.
MATCH path=(e:Email)-[:NEXT*1..3]->(a)
WHERE date("2019-02-01") <= head(tail(nodes(path))).date < date("2019-03-01")
WITH [x IN tail(nodes(path)) | x.type] AS types
RETURN REDUCE(key = types[0], n IN types[1..] | key + "-" + n) AS key, COUNT(*)
ORDER BY key DESC

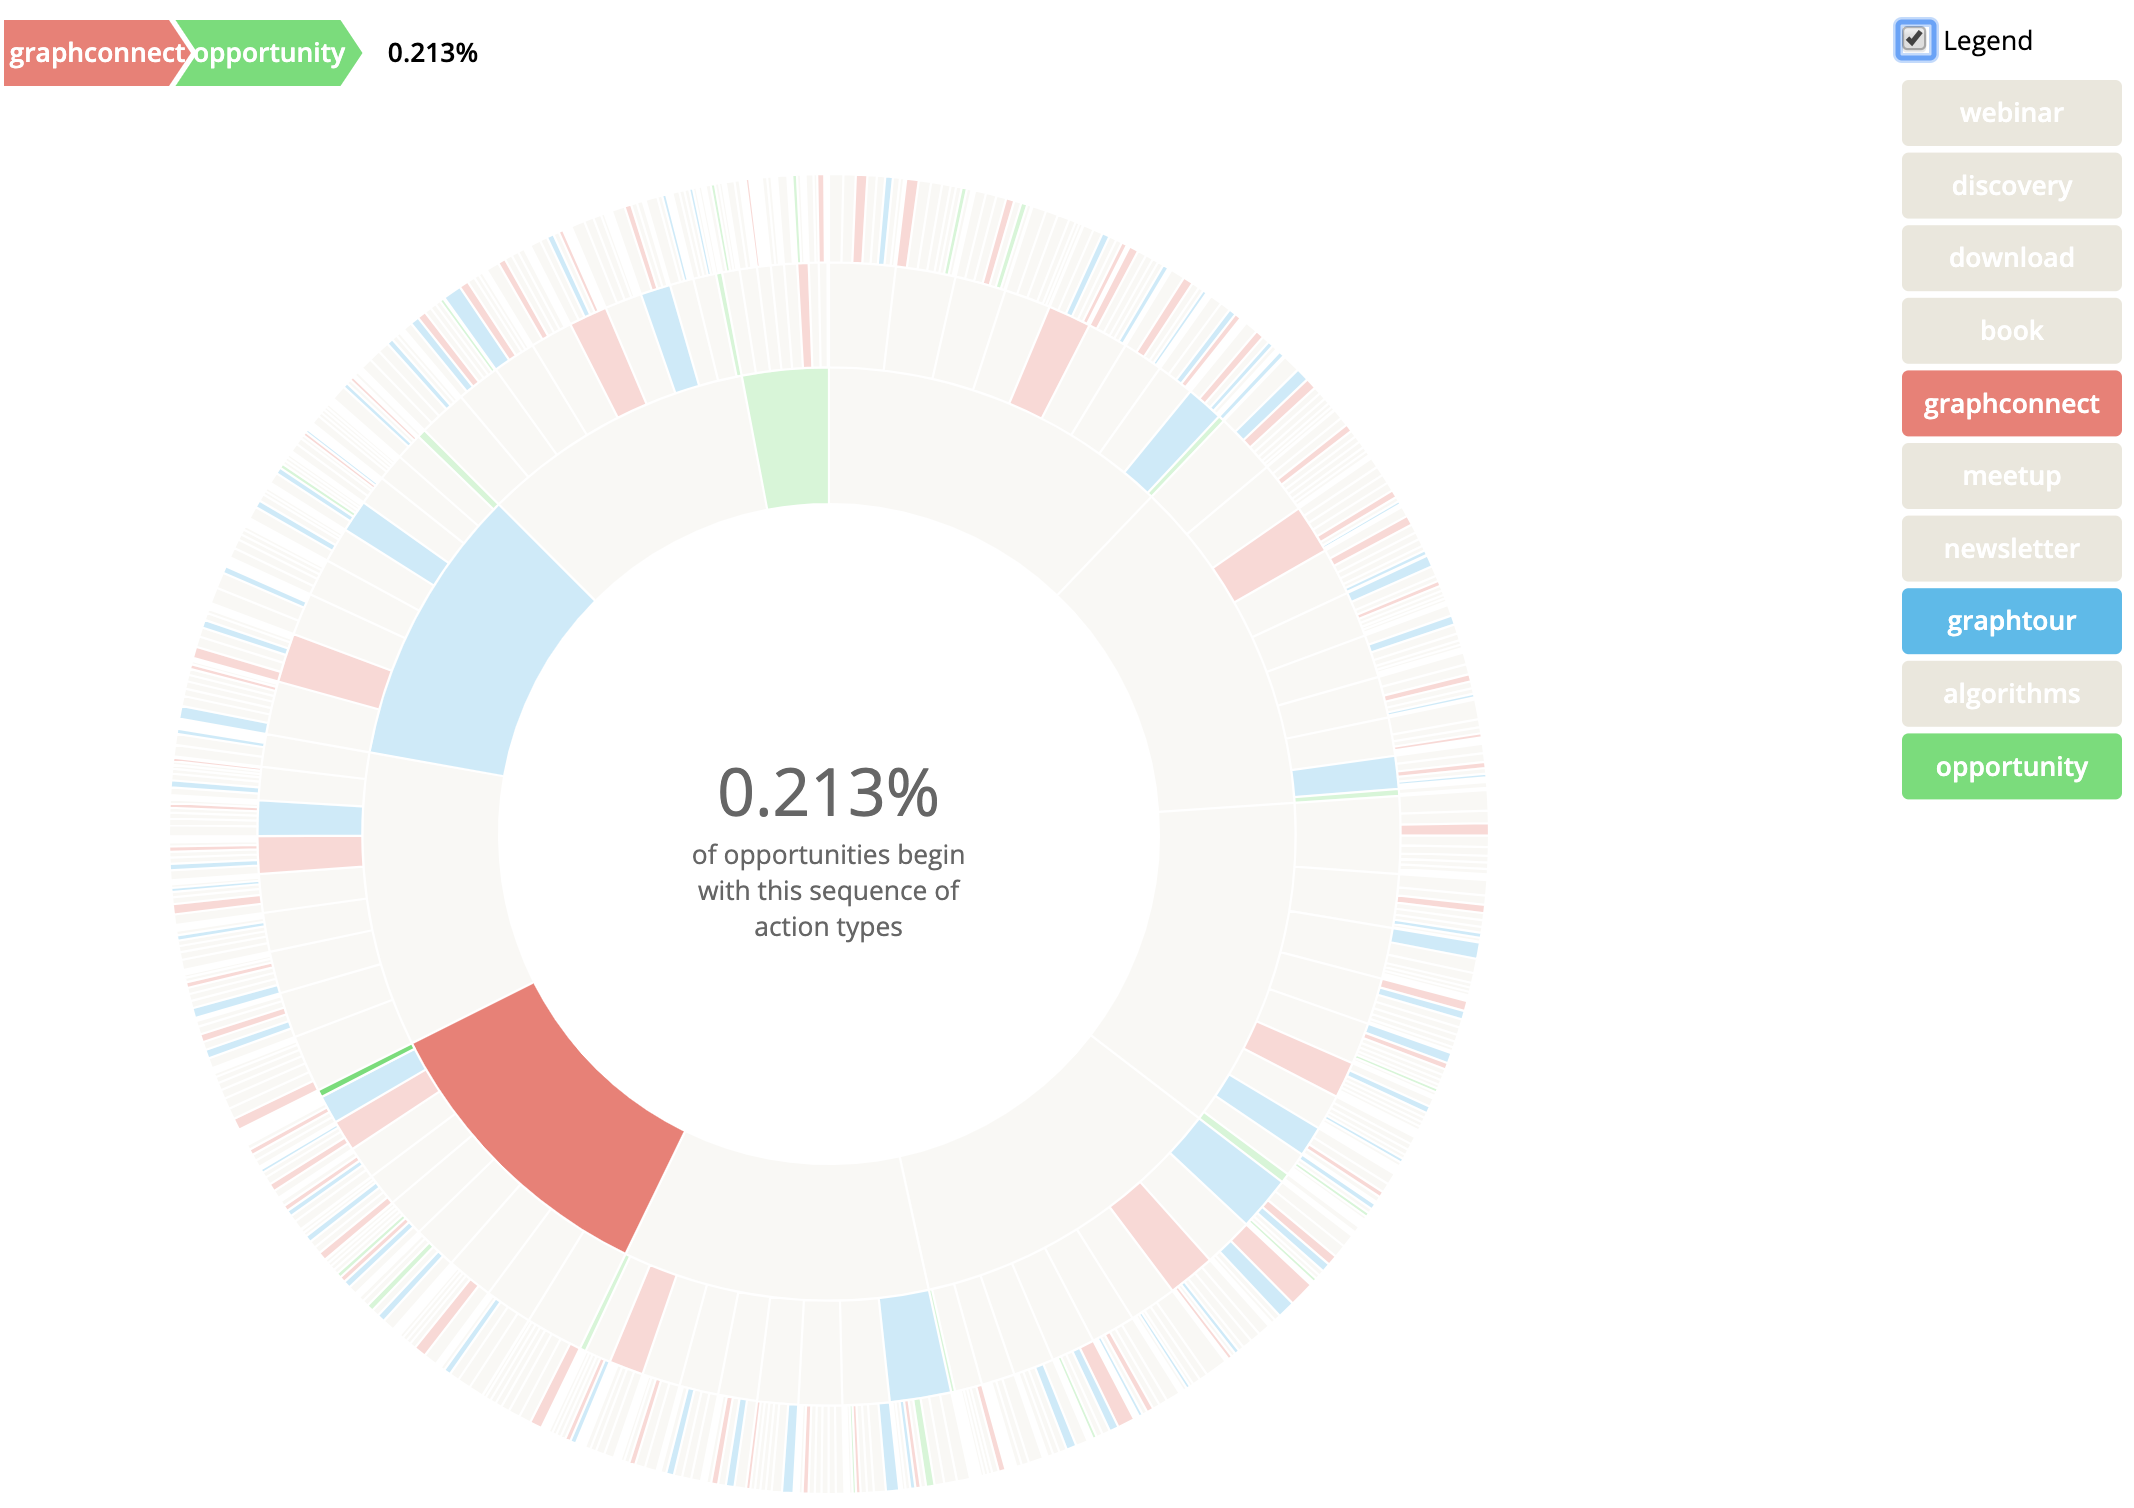
We can also focus in one one or a few event types. For example, let’s look at just “graphconnect”, “graphtour” and “opportunity” events. We can change the colors to highlight those 3 and combine the rest into a single background color:
var colors = {
	"webinar": "#EAE7DC",
	"discovery": "#EAE7DC",
	"download": "#EAE7DC",
	"book": "#EAE7DC",
	"graphconnect": "#E98074",
	"meetup": "#EAE7DC",
	"newsletter": "#EAE7DC",
	"graphtour": "#5AB9EA",
	"algorithms": "#EAE7DC",
	"opportunity": "#77DD77",
}
You have plenty of different ways to slice and dice the data. Here I am just exporting to CSV and using that file in my javascript, but you can build a better version that gets its data from the query automatically and skip the download step. I’ll leave that to the Javascript aficionados. While I have your attention I wanted to show you a few more Activity based queries that may be of interest:
Given five step activities that end in an “opportunity”, given the start of the journey which activities along the path were performed that eventually turned into an opportunity.
MATCH path=(a1:Activity)-[:NEXT*1..5]->(a4:Activity)
WHERE a4.type = "opportunity"
WITH a1.type AS start, [x IN nodes(path) | x.type] AS types, COUNT(path) AS count
MATCH (at:ActivityType)
WHERE NOT (at.name = "opportunity" OR at.name = start)
WITH at.name AS step, start, types, count
WITH start, count, step, CASE WHEN ANY (x IN types WHERE x IN step) THEN 1 ELSE 0 END AS included
WITH start, step, SUM(count) AS sum_all, SUM(included) AS sum_included
RETURN start, step, sum_included/(1.0 * sum_all) AS pct
ORDER BY start, pct DESC
What is the average number of days between activities in 2-4 hop sequences:
MATCH p=(a1:Activity)-[:NEXT*1..3]->(a2:Activity)
WHERE a2.type = "opportunity"
WITH [x IN NODES(p) | x] AS activities
UNWIND RANGE(0,SIZE(activities) - 2) AS idx
RETURN [x IN activities | x.type], COUNT(*),
avg(duration.between(activities[idx].date, activities[idx+1].date).days) AS avg_days_between_activities
ORDER BY count(*) DESC
What is the average number of days between individual activities in 2-4 hop sequences:
MATCH p=(a1:Activity)-[:NEXT*1..3]->(a2:Activity)
WHERE a2.type = "opportunity"
WITH [x IN NODES(p) | x] AS activities
UNWIND RANGE(0,LENGTH(activities) - 2) AS idx
WITH [x IN activities | x.type] AS types, idx, AVG(duration.between(activities[idx].date,  activities[idx+1].date).days) AS between, COUNT(*) AS number
WITH types, COLLECT(between) AS days, number
RETURN types, days, SUM(number) AS count
ORDER BY count DESC
What is the number of days between activities for an individual user:
MATCH p=(e:Email {address: "drezet2@icloud.com"})-[:NEXT*]->(a)
WHERE SIZE((a)-[:NEXT]->()) = 0
WITH [x IN TAIL(NODES(p)) | x] AS activities
UNWIND RANGE(0,LENGTH(activities) - 2) AS idx
WITH [x IN activities | x.type] AS types, idx, AVG(duration.between(activities[idx].date,  activities[idx+1].date).days) AS between
WITH types, COLLECT(between) AS days
RETURN types, days
Hopefully these give you some new ideas of the types of questions you can ask of your data.
