
Yes, I’m slowly but surely getting on the generative AI bandwagon. The eye catching image above was generated in Lexica, it’s not perfect but our mind tricks us into accepting it. I am not a fan of asking these new AI systems questions and getting answers that only look like correct answers… but we’re not talking about that today. Instead we’ll be looking at improving the performance of RageDB using “perf” and “FlameGraphs“. Which really should have been called “FlameCharts” since it’s a chart not a graph but let’s not go there either.
Let’s take a look at the first LDBC SNB Interactive Short Query One. This query takes a person_id as a parameter, then gets the properties of that person as well as the id of the place where that person is located. The query looks like this in RageDB:
-- Interactive Short 1
ldbc_snb_is01 = function(person_id)

    local properties = NodeGetProperties("Person", person_id)
    local city = NodeGetNeighbors("Person", person_id, Direction.OUT, "PERSON_IS_LOCATED_IN")[1]
    local result = {
        ["person.firstName"] = properties["firstName"],
        ["person.lastName"] = properties["lastName"],
        ["person.birthday"] = properties["birthday"],
        ["person.locationIP"] = properties["locationIP"],
        ["person.browserUsed"] = properties["browserUsed"],
        ["city.id"] = city:getProperty("id"),
        ["person.gender"] = properties["gender"],
        ["person.creationDate"] = DateToISO(properties["creationDate"])
    }

    return result
end
When I run my Gatling tests against Scale Factor 1 on my local machine I get these results:
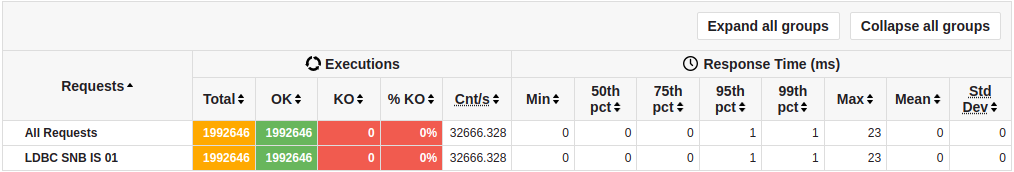
Think about that for a second, no really a second. I’m sending in a query by an http request, it is getting executed and returned back as JSON so fast that on a 4 core machine RageDB can perform this query 32 thousand times in that one second. There are only 1000 milliseconds in a second, so we’re down to fractions of a milliseconds to get a response… and that’s not even the best query. LDBC SNB Short Query Four gets 48 thousand requests per second. Tell me again why database developers waste time building binary protocol drivers in a bunch of languages? It’s all going to get turned back into JSON by the front end anyway.
Anyway, we’re going to run it again, but this time we’ll run perf to capture what is going on. First at bit of setup. I’ll alias perf to point to the binary, I’ll add “0” to kptr_restrict so we can see kernel addresses in perf, and finally I’ll find the process identifier for the instance of ragedb I’m running right now.
$ alias perf=$(find /usr/lib/linux-tools/*/perf | head -1)
$ sudo sh -c " echo 0 > /proc/sys/kernel/kptr_restrict"
$ ps ax | fgrep ragedb
36583 pts/1    Ssl+  13:17 /home/max/CLionProjects/ragedb/cmake-build-relwithdebinfo/bin/ragedb -c4
Notice Rage is running in CLion in “Release with Debug Information” mode and somewhere in my CMake configuration I added the compile option to NOT omit frame pointers:
add_compile_options(-fno-omit-frame-pointer)
With all that in place we’ll also grab FlameGraphs from github and record our process id for RageDB, making sure we pass in options to get the call graph and record at a frequency of 99 per second because that’s what Brendan Gregg says.
git clone https://github.com/brendangregg/FlameGraph.git
cd FlameGraph
perf record -p 36583 --call-graph lbr -F 99
Here I run the Gatling test again for one minute and then stop perf with Control-C. Two more commands to run in order to create perf.svg and we can open it up in a web browser.
perf script | ./stackcollapse-perf.pl > out.perf-folded
./flamegraph.pl out.perf-folded > perf.svg
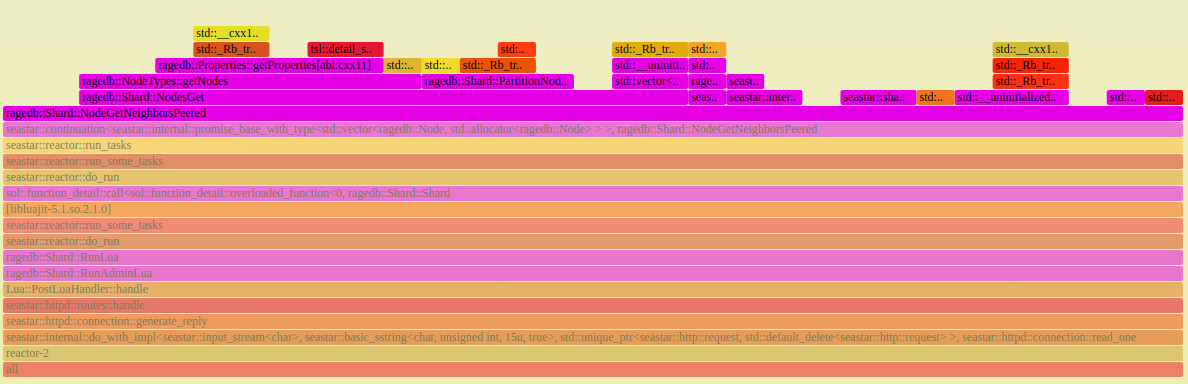
Now, it looks like a terrible mess with 4 tall columns, one for each core. In the search bar on the top right I added “rage” and it highlights our methods in purple:

I’m going to click on “reactor-2” and it will zoom in a little bit for us so we can see what’s going on. It’s still a little hard, but we can see it is calling “NodeGetNeighborsPeered” which comes from this part of the query:
local city = NodeGetNeighbors("Person", person_id, Direction.OUT, "PERSON_IS_LOCATED_IN")[1]
Using my eyeballs, something catches my attention. We seem to spend a bunch of time in “PartitionNodeIdsByTypeId” when I thought that method was supposed to be pretty inexpensive.
Let’s take a look at the code:
    std::map<uint16_t, std::vector<uint64_t>> Shard::PartitionNodeIdsByTypeId(const std::vector<uint64_t> &ids) const {
        std::map<uint16_t, std::vector<uint64_t>> partitioned_ids;
        auto max_size = node_types.getSize();
        for (uint16_t i = 0; i < max_size; i++) {
            partitioned_ids.insert({i, std::vector<uint64_t>() });
        }
        for (const auto& id : ids) {
            uint16_t type_id = externalToTypeId(id);
            // Insert Sorted
            partitioned_ids.at(type_id).emplace_back(id);
        }

        for (uint16_t i = 0; i < max_size; i++) {
            if (partitioned_ids.at(i).empty()) {
                partitioned_ids.erase(i);
            } else {
                sort(partitioned_ids.at(i).begin(), partitioned_ids.at(i).end());
            }
        }
        // Sort ids
        for(auto& [shard, vec] : partitioned_ids) {
            std::sort(vec.begin(), vec.end());
        }

        return partitioned_ids;
    }
It is being called by NodesGet which takes any node ids and retrieves them. Since RageDB has Schema we are splitting them up by type into separate vectors and putting those vectors in a map by their type id. This is reasonable when you have lots of different node types in a single request, but that’s not a typical scenario. Most of the time we’ll be asking for nodes of a single type. Also I seem to be sorting the node ids twice for no good reason. Must be a copypasta error. Let’s rewrite the method to be a little smarter and not create a bunch of map of mostly empty vectors and then delete them.
    std::unordered_map<uint16_t, std::vector<uint64_t>> Shard::PartitionNodeIdsByTypeId(const std::vector<uint64_t> &ids) const {
        std::unordered_map<uint16_t, std::vector<uint64_t>> partitioned_ids;

        for (const auto& id : ids) {
            uint16_t type_id = externalToTypeId(id);
            partitioned_ids[type_id].emplace_back(id);
        }

        // Sort ids
        for(auto& [shard, vec] : partitioned_ids) {
            std::sort(vec.begin(), vec.end());
        }

        return partitioned_ids;
    }
First, there is no need to return a regular map, we don’t need the type ids to be ordered, so we can return an unordered map and avoid sorting keys. Second there is no need to create vectors for all the node types, just the ones for the ids that actually get passed in. So there is no need to erase empty ones. Now we can recompile our code, run it again, run the gatling test and see what it says:
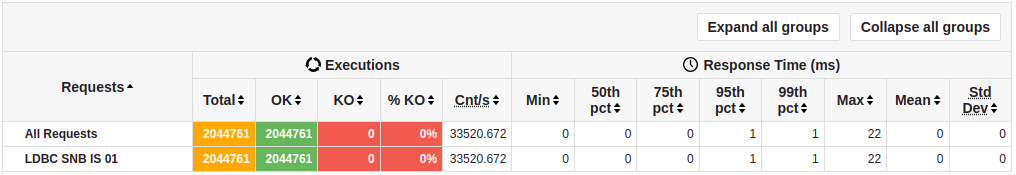
We went from about 32.5k requests per second to 33.5k req/s. When we record using perf and take a look at the flame graph again we can see the amount of time spent there was cut by about half so we can barely see the prefix. It’s just underneath the second orange box.
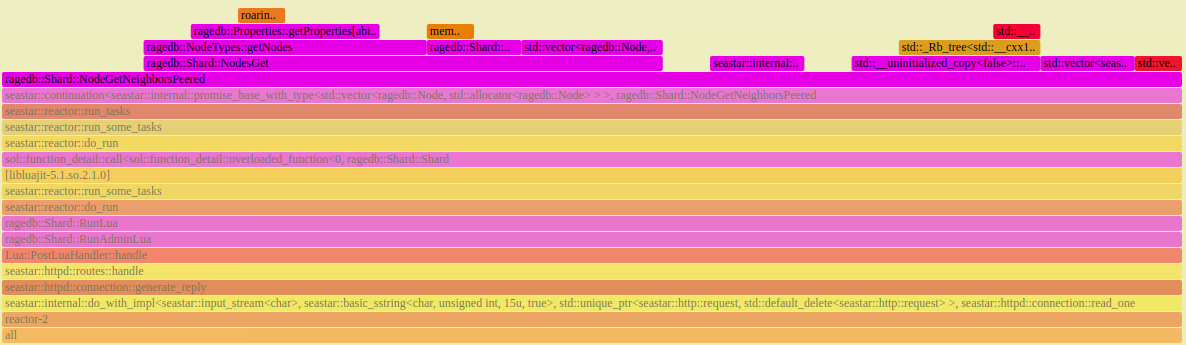
This small change should have a positive effect on many other queries as well. Let’s see:
| Query | Requests per second (Before) | Requests per second (After) | Change | Percent Change |
| LDBC SNB Short Q1 | 32666 | 33520 | 854 | 2.6% |
| LDBC SNB Short Q2 | 2030 | 2078 | 48 | 2.3% |
| LDBC SNB Short Q3 | 2328 | 2368 | 40 | 1.7% |
| LDBC SNB Short Q4 | 48471 | 49680 | 1209 | 2.5% |
| LDBC SNB Short Q5 | 45005 | 46424 | 1419 | 3.1% |
| LDBC SNB Short Q6 | 33152 | 34111 | 959 | 2.9% |
| LDBC SNB Short Q7 | 21816 | 22477 | 661 | 3.0% |
I’ll dig for more performance issues with perf and update the benchmark results when I get the chance.
If any of the above sounded like fun to you and you want to get involved, please reach out. I’m looking for help!

I’ve been enjoying reading your posts ever since you started building ragedb, would love to help but unfortunately don’t think I have the requisite skills you need :-(
My background is non-CS, self taught (ie probably badly) vba, sql, cypher.
Just thought I’d reply so you don’t think you’re just talking into the void!