
In part 4 I promised metrics and a shell, so that’s what we’ll tackle today. We are lucky that the Metrics library can be plugged into Jooby without much effort… and double lucky that the Crash library can also be plugged into Jooby without much effort. This is what we are all about here because we’re a bunch of lazy, impatient developers who are ignorant of the limits of our capabilities and who would rather reuse open source code instead of falling victim to the “Not Invented Here” syndrome and do everything from scratch.
Alright, let’s get to it. First thing we’re going to do is add metrics to our server by adding this:
        // Metrics
        use(new Metrics()
                .request()
                .threadDump()
                .ping()
                .healthCheck("db", new DatabaseHealthCheck())
                .metric("memory", new MemoryUsageGaugeSet())
                .metric("threads", new ThreadStatesGaugeSet())
                .metric("gc", new GarbageCollectorMetricSet())
                .metric("fs", new FileDescriptorRatioGauge())
        );
Except for the DatabaseHealthCheck, all of these come pre-made for us. The health check is super simple and just needs to tell us if it’s alive or dead. We can figure that out by just making sure our singleton instance of GuancialeDB is available:
public class DatabaseHealthCheck extends HealthCheck {
    @Override
    public HealthCheck.Result check() throws Exception {
        if (GuancialeDB.getInstance().isAvailable()) {
            return HealthCheck.Result.healthy();
        } else {
            return HealthCheck.Result.unhealthy("Database is not available");
        }
    }
}
Great. Now when we run our server we get a whole bunch of new routes:
  GET    /sys/metrics                                      [*/*]                  [*/*]    (/anonymous)
  GET    /sys/metrics/:type                                [*/*]                  [*/*]    (/anonymous)
  GET    /sys/healthcheck                                  [*/*]                  [*/*]    (/anonymous)
  GET    /sys/thread-dump                                  [*/*]                  [*/*]    (/anonymous)
  GET    /sys/ping                                         [*/*]                  [*/*]    (/anonymous)
A request to /sys/ping just returns “pong” to validate our server instance is up and running. Calling /sys/thread-dump gives a steaming pile of thread information. A nice json blob comes from /sys/healthcheck:
{"db":{"healthy":true,"message":null,"error":null}}
…and another one from /sys/metrics
{"counters":{"request.actives":0},"gauges":{"fs":0.01943359375,"gc.PS-MarkSweep.count":2,"gc.PS-MarkSweep.time":110,"gc.PS-Scavenge.count":95,"gc.PS-Scavenge.time":289,"memory.heap.committed":253755392,"memory.heap.init":268435456,"memory.heap.max":3817865216,"memory.heap.usage":0.018160555199652182,"memory.heap.used":69334552,"memory.non-heap.committed":69861376,"memory.non-heap.init":2555904,"memory.non-heap.max":-1,"memory.non-heap.usage":-6.7383896E7.....
Ok, great. We can hook these up to Ganglia or Graphite or whatever and be done with it… but wouldn’t it be more fun to show a little something on the server itself? Of course it would. So let’s do that. We’re going to borrow Cubism.js and display our metrics over time using javascript. I have a call to /sys/metrics running every second updating “measurements”.
<script src="/assets/js/d3.min.js"></script>
<script src="/assets/js/cubism.v1.min.js"></script>
<script>

    var measurements = {};

    function refreshData()
    {
        d3.json("/sys/metrics", function(data) {
            measurements = data;
        });

        setTimeout(refreshData, 1000);
    }
Our cubism context runs every second, getting new data from measurements.
    var context = cubism.context()
        .serverDelay(1e3)
        .clientDelay(1e3)
        .step(1e3)
        .size(960);
Then we have an array which only adds the metrics we are interested in. I had to use a normalizer since cubism is scaled for single digits. Maybe there is a better way to do this, but this works for now.
    var jooby =[];
    jooby.push(metrics("counters","request.actives", 1, ""));
    jooby.push(metrics("gauges","memory.total.used", 100000000, "(100MB)"));
    jooby.push(metrics("gauges","memory.total.committed", 100000000, "(100MB)"));
    jooby.push(metrics("gauges","threads.blocked.count", 1, ""));
    jooby.push(metrics("gauges","threads.count", 1, ""));
The metrics function returns the last 960 values it gathers from the continuously updating measurements object and uses the normalizer to scale down large values.
 return context.metric(function(start, stop, step, callback) {
            start = +start, stop = +stop;
            if (isNaN(last)) last = start;
            while (last < stop) {
                last += step;
                if (measurements.hasOwnProperty(type)) {
                    value = measurements[type][name];
                }
                values.push(value / normalizer);
            }
            callback(null, values = values.slice((start - stop) / step));
        }, name + " " + unit);
This code all goes in /public/dashboard.html and once we add it to our routes:
get("/dashboard", req -> Results.html("dashboard"));
We get this visualization:
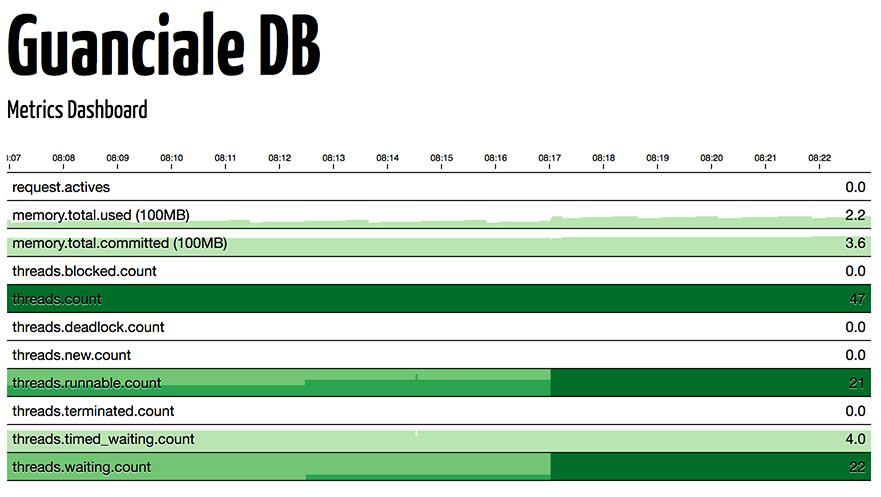
We can put that on a white label 12 inch and send it to the clubs… or just display it on a monitor in your NOC or devops monitoring station.
Alright what about a shell?

We’re going to inject Crash into our server by adding a bunch of dependencies:
        <dependency>
            <groupId>org.jooby</groupId>
            <artifactId>jooby-crash</artifactId>
            <version>${jooby.version}</version>
        </dependency>
        <dependency>
            <groupId>org.jooby</groupId>
            <artifactId>jooby-banner</artifactId>
            <version>${jooby.version}</version>
        </dependency>
        <dependency>
            <groupId>org.crashub</groupId>
            <artifactId>crash.connectors.ssh</artifactId>
            <version>${crash-connectors.version}</version>
        </dependency>
        <dependency>
            <groupId>org.crashub</groupId>
            <artifactId>crash.connectors.web</artifactId>
            <version>${crash-connectors.version}</version>
        </dependency>
..and using it in our server. Notice I included “Banner” what does it do?
        // Banner
        use(new Banner("Guanciale DB"));

        // Shell
        use(new Crash());
It creates an awesome ASCII art banner for our shell when we log in. I restarted the server and using the default admin/admin credentials I log in and get this:
maxdemarzi$ ssh -p 2000 admin@localhost
Password authentication
Password:
________                           ____        _____           _______ _______
_  ____/___  _______ _______ ________(_)_____ ___  /____       __  __ \__  __ )
  / __    / / /  __ `/_  __ \  ___/_  /   __ `/_  /   _ \      _  / / /_  __  |
 /_/ /   /_/ /  /_/ /   / / / /__    /   /_/ /   /    __/        /_/ /   /_/ /
____/   __,_/  __,_/  _/ /_/ ___/  _/   __,_/  _/   ___/       _____/  _____/ v0.0.0
If you’ve been following the story of hackers stealing thousands of Mongo databases, you know leaving it with the defaults is a bad idea. There are ways to customize that, but for now we’ll leave it admin/admin.
Ok, so we have a shell, and it has some built in commands we can try out if we type “help”. But I want my own custom commands to give me the same functionality as the REST API did. We can build one by extending BaseCommand. Below I replicate the :GET /db/node/{id} functionality:
@Usage("Get")
public class get extends BaseCommand {

    private static final ObjectMapper mapper = new ObjectMapper();

    @Usage("node <id>")
    @Named("node")
    @Command
    public void node(InvocationContext<ObjectName> context,
                     @Usage("the node id") @Argument final String id) throws Exception {
        Object node = Server.db.getNode(id);
        if (node == null) {
            throw new Err(Status.NOT_FOUND);
        } else {
            context.append(mapper.writeValueAsString(node));
        }
    }
Pretty easy stuff, what about out node degree? Here you go:
    @Usage("node-degree <id>")
    @Named("node-degree")
    @Command
    public void node(InvocationContext<ObjectName> context,
                     @Usage("the node id") @Argument final String id,
                     @Usage("only incoming relationships") @Option(names = {"in","incoming"}) final Boolean incoming,
                     @Usage("only outgoing relationships") @Option(names = {"out","outgoing"}) final Boolean outgoing,
                     @Usage("the relationship types") @Option(names="types") List<String> types) throws Exception {
        Object node = Server.db.getNode(id);
        if (node == null) {
            throw new Err(Status.NOT_FOUND);
        } else {
            if(types == null) {
                types = new ArrayList<String>();
            }
            if(Boolean.TRUE.equals(incoming) ) {
                context.append(Server.db.getNodeDegree(id, "in", types ).toString());
            } else if (Boolean.TRUE.equals(outgoing)) {
                context.append(Server.db.getNodeDegree(id, "out", types).toString());
            } else {
                context.append(Server.db.getNodeDegree(id, "all", types).toString());
            }
        }
    }
Once I restart the server and try:
get node-degree --help
I get an explanation of the command :
usage: get [-h | --help] node-degree [--in | --incoming] [--out | --outgoing] [--types] <arg>

   [-h | --help]        this help
   [--in | --incoming]  only incoming relationships
   [--out | --outgoing] only outgoing relationships
   [--types]            the relationship types
I created a node “max” with an outgoing relationship to another node, so now in my shell I can do:
dev> get node max
{"name":"Max"}
dev> get node-degree --out max
1
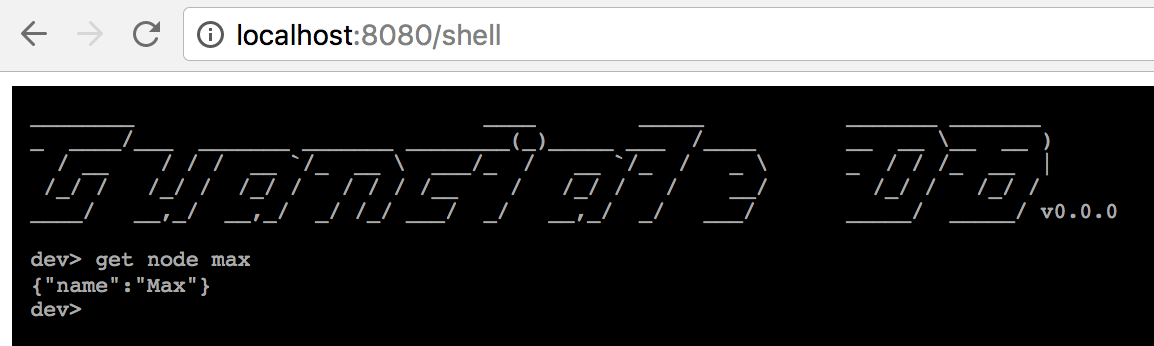
Pretty neat right? But there is more… we actually get a free web shell too!
Alright. Now I have to finish off the rest of the shell commands, but I won’t bore you with that. Stay tuned for more, we still need a binary protocol, persistence and replication.

[…] On to Part 5. […]