
How does the saying go? There are lies, damned lies, and benchmarks. I’ve already made my feelings about database vendor benchmarks known, but in case you missed it. They are complete fabrications. Never to be trusted, never ever. Never. But vendors love to do benchmarks, they love spreading fear, uncertainty and doubt instead of spending their time doing productive things like creating useful content that teaches people how to use their product. I wish I could just ignore this nonsense and focus on what really matters, like helping our customers to successful production rollouts, but alas, here we are.
A vendor paid an assistant professor and his teaching assistant to publish a paper comparing the performance of their product against Neo4j, and came to the conclusion that (wait, you won’t see it coming) their product is better. The benchmark compares the “community editions” of both products, which nobody deploys in production. They run dynamic Cypher queries via JDBC via Python to Neo4j against installed and compiled into machine code stored procedures from the other vendor. Ok that’s apples to oranges, but let’s continue. The hardware they used has 16, 32 or 64 cores…and they run each query a grand total of TEN times. Ten times… one after the other, waiting for each to finish before continuing. Exactly like it would never ever ever run in production.
Neo4j Community edition only has the “interpreted runtime“, it doesn’t benefit from the slotted or compiled runtimes available in the Enterprise edition. The interpreted runtime executes each query in a SINGLE THREAD, but the other vendor is running compiled queries on a parallelized runtime which will benefit from those 16, 32 and 64 cores. We’ve left the realm of apples to oranges, and are now comparing apples to bananas. Calm down, it’s a totally fair and unbiased benchmark produced by rigorous academics.
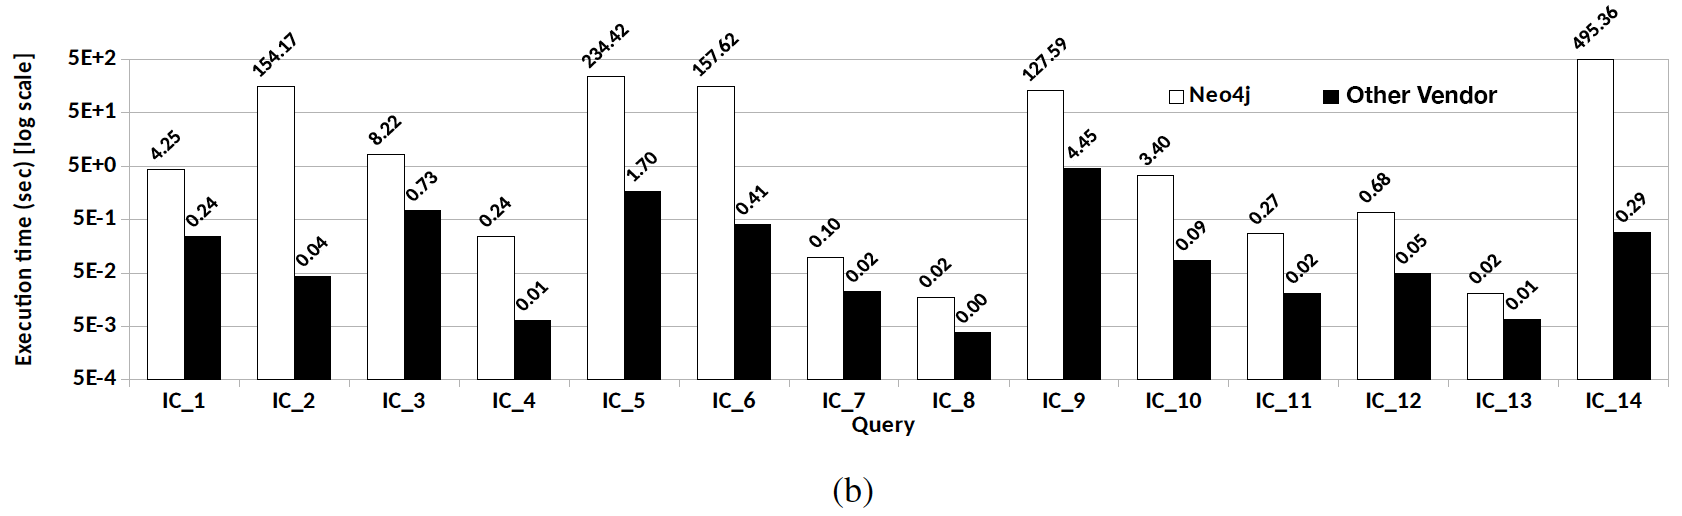
The benchmark has four datasets, tiny, small, medium and large. Let’s take a look at the results of the small dataset which has about 30 million nodes and 175 million relationships. We’ll start with the “Interactive Short” (IS) Queries:

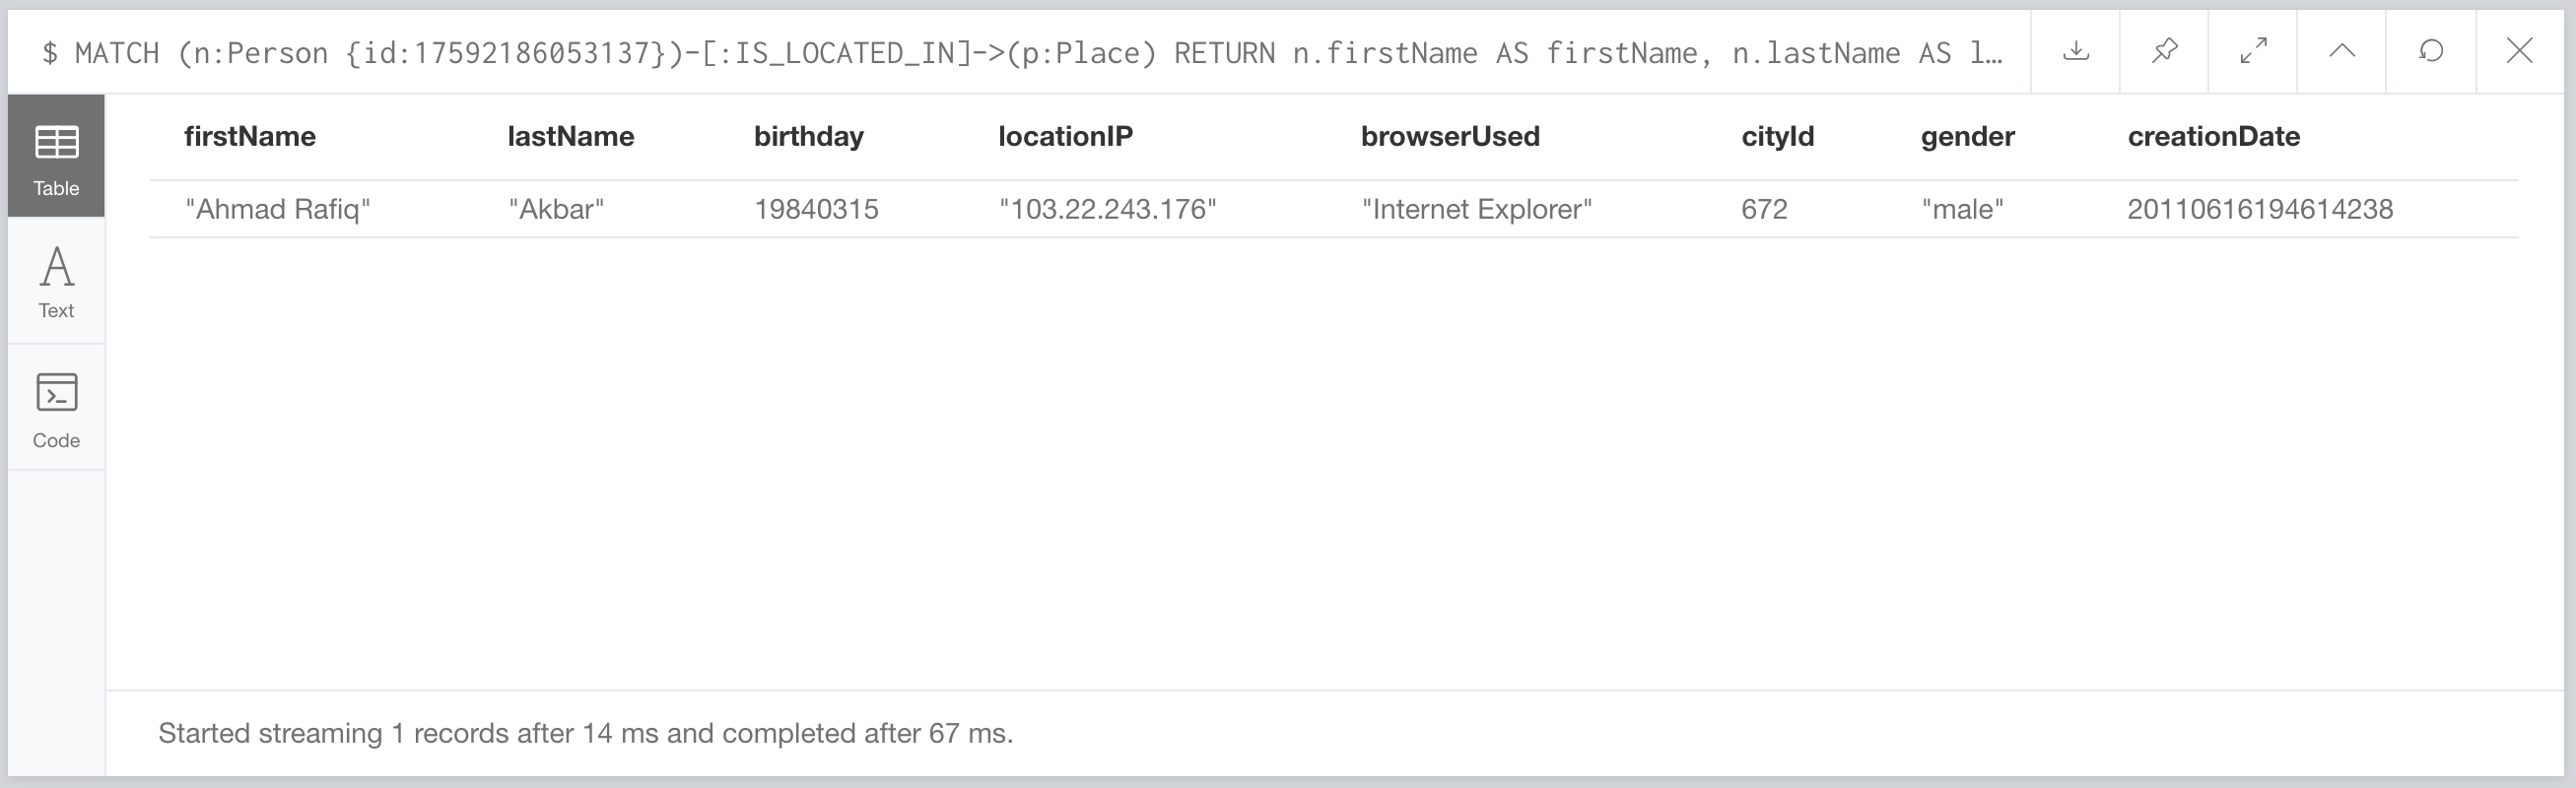
The first set of bars belongs to “IS_1” which is this query in Neo4j:
MATCH (n:Person {id:$personId})-[:IS_LOCATED_IN]->(p:Place)
RETURN
  n.firstName AS firstName,
  n.lastName AS lastName,
  n.birthday AS birthday,
  n.locationIP AS locationIP,
  n.browserUsed AS browserUsed,
  p.id AS cityId,
  n.gender AS gender,
  n.creationDate AS creationDate
Now, in any kind of reasonable real world benchmark the $personId would be populated from a list of randomly chosen ids, but in this benchmark they only test a single value “17592186053137”. Why was this value selected over all the others? Who knows. But keep this in mind since if you wanted to make sure your product always “won” you would select a value where it did and ignore all the other values. I tried running the benchmark code as they wrote it. It was a giant pile of “copy pasta” Python and eventually gave up. But I did load the small dataset into my Mid 2015 MacBook Pro on a local Neo4j 3.5.0 community edition (which is outdated, use 3.5.8+ and never use a .0 release in production). So let’s try the query.
It took 67ms. Ok. That’s faster than the 116ms they measured. But the benchmark says they throw out the first run of each query since it always takes longer. Cypher has to create an execution plan the first time it sees a query, but afterwards it just plugs in the new parameters and executes the already built plan. So let’s run it again:
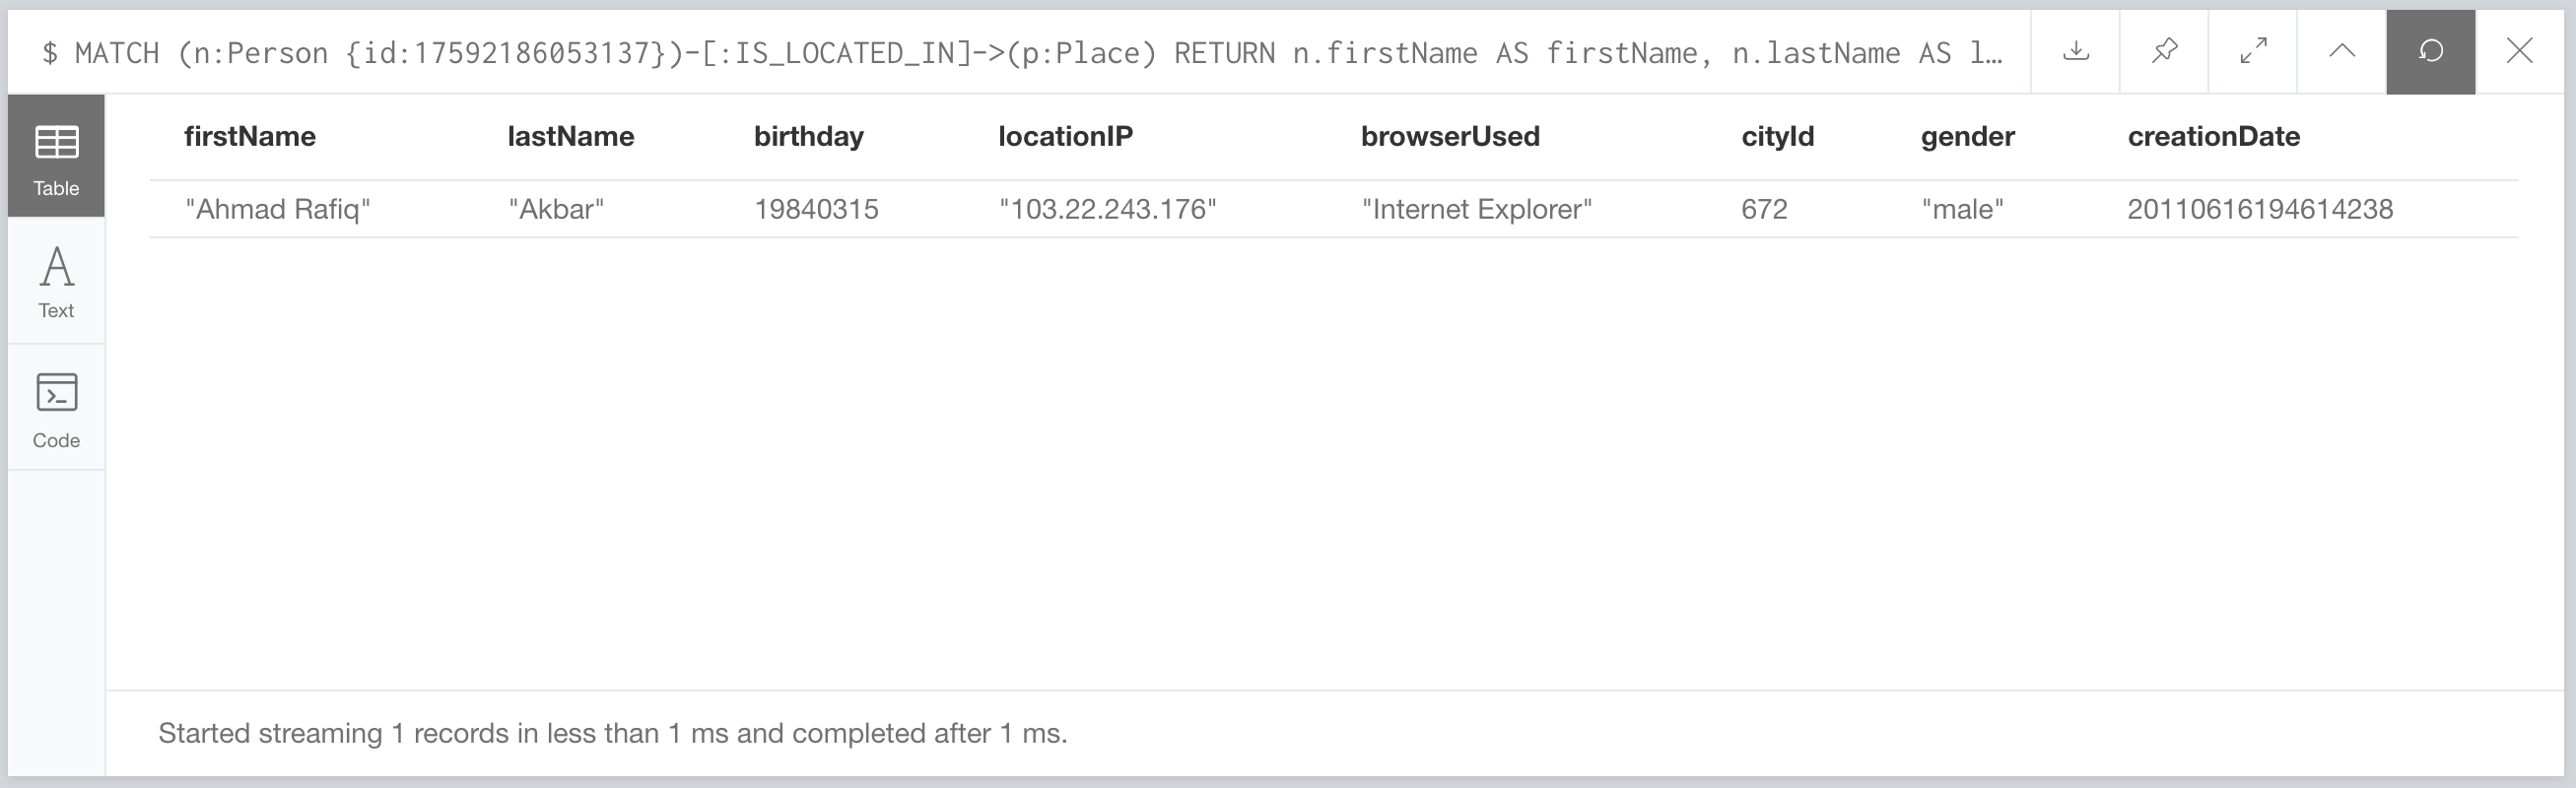
What? 1ms? But that’s much much faster than the 116.71ms the vendor reported. It’s also faster than the other vendor which clocks in at 2.64ms according to their numbers. So weird, how could the first thing we try already not be reproducible? You know what, it’s kind of strange to just run a single query via the browser interface. How about instead we use a real performance testing tool like Gatling and try our Cypher query via HTTP and instead of just once, what if we hammer it for 30 seconds on all 8 threads of my 4 core laptop?
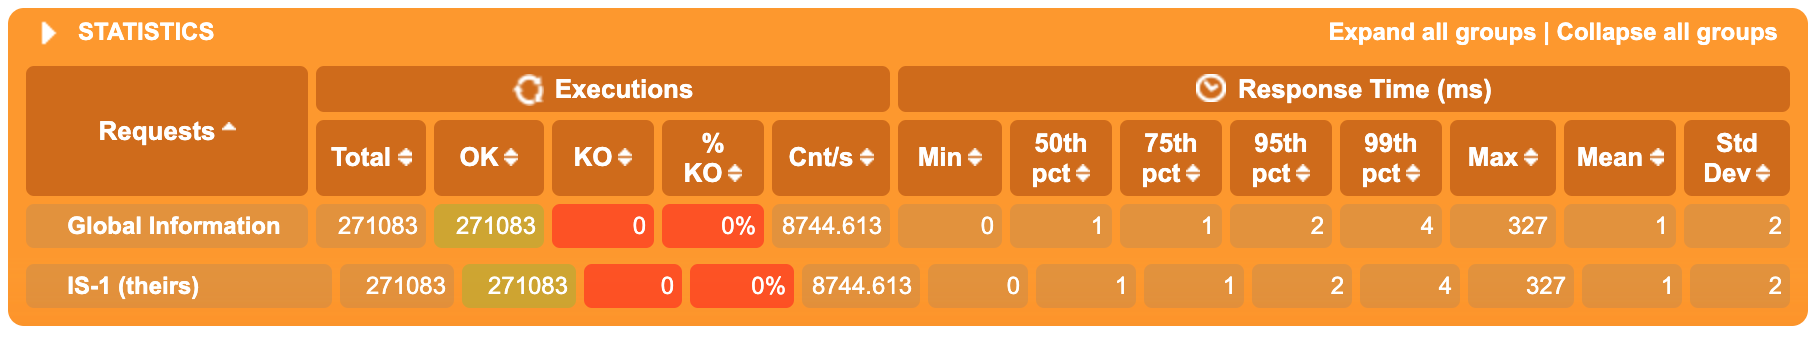
So we have a mean of 1ms, 99% at 4ms and a max of 327 (that’s what I get for running the load testing tool on the same machine as the Neo4j server). So 8744 successful requests per second on this 4 year old 4 core laptop. That’s a very different feeling than what they reported. Their reported execution time of 116.71ms would lead you to believe Neo4j could handle less than 10 queries per second on their 16 core machine, when that is absolutely not the truth.
Ok, maybe that was a fluke. People are human, they make mistakes. Remember Hanlon’s razor: “Never attribute to malice that which is adequately explained by stupidity”. Let’s try the next query.
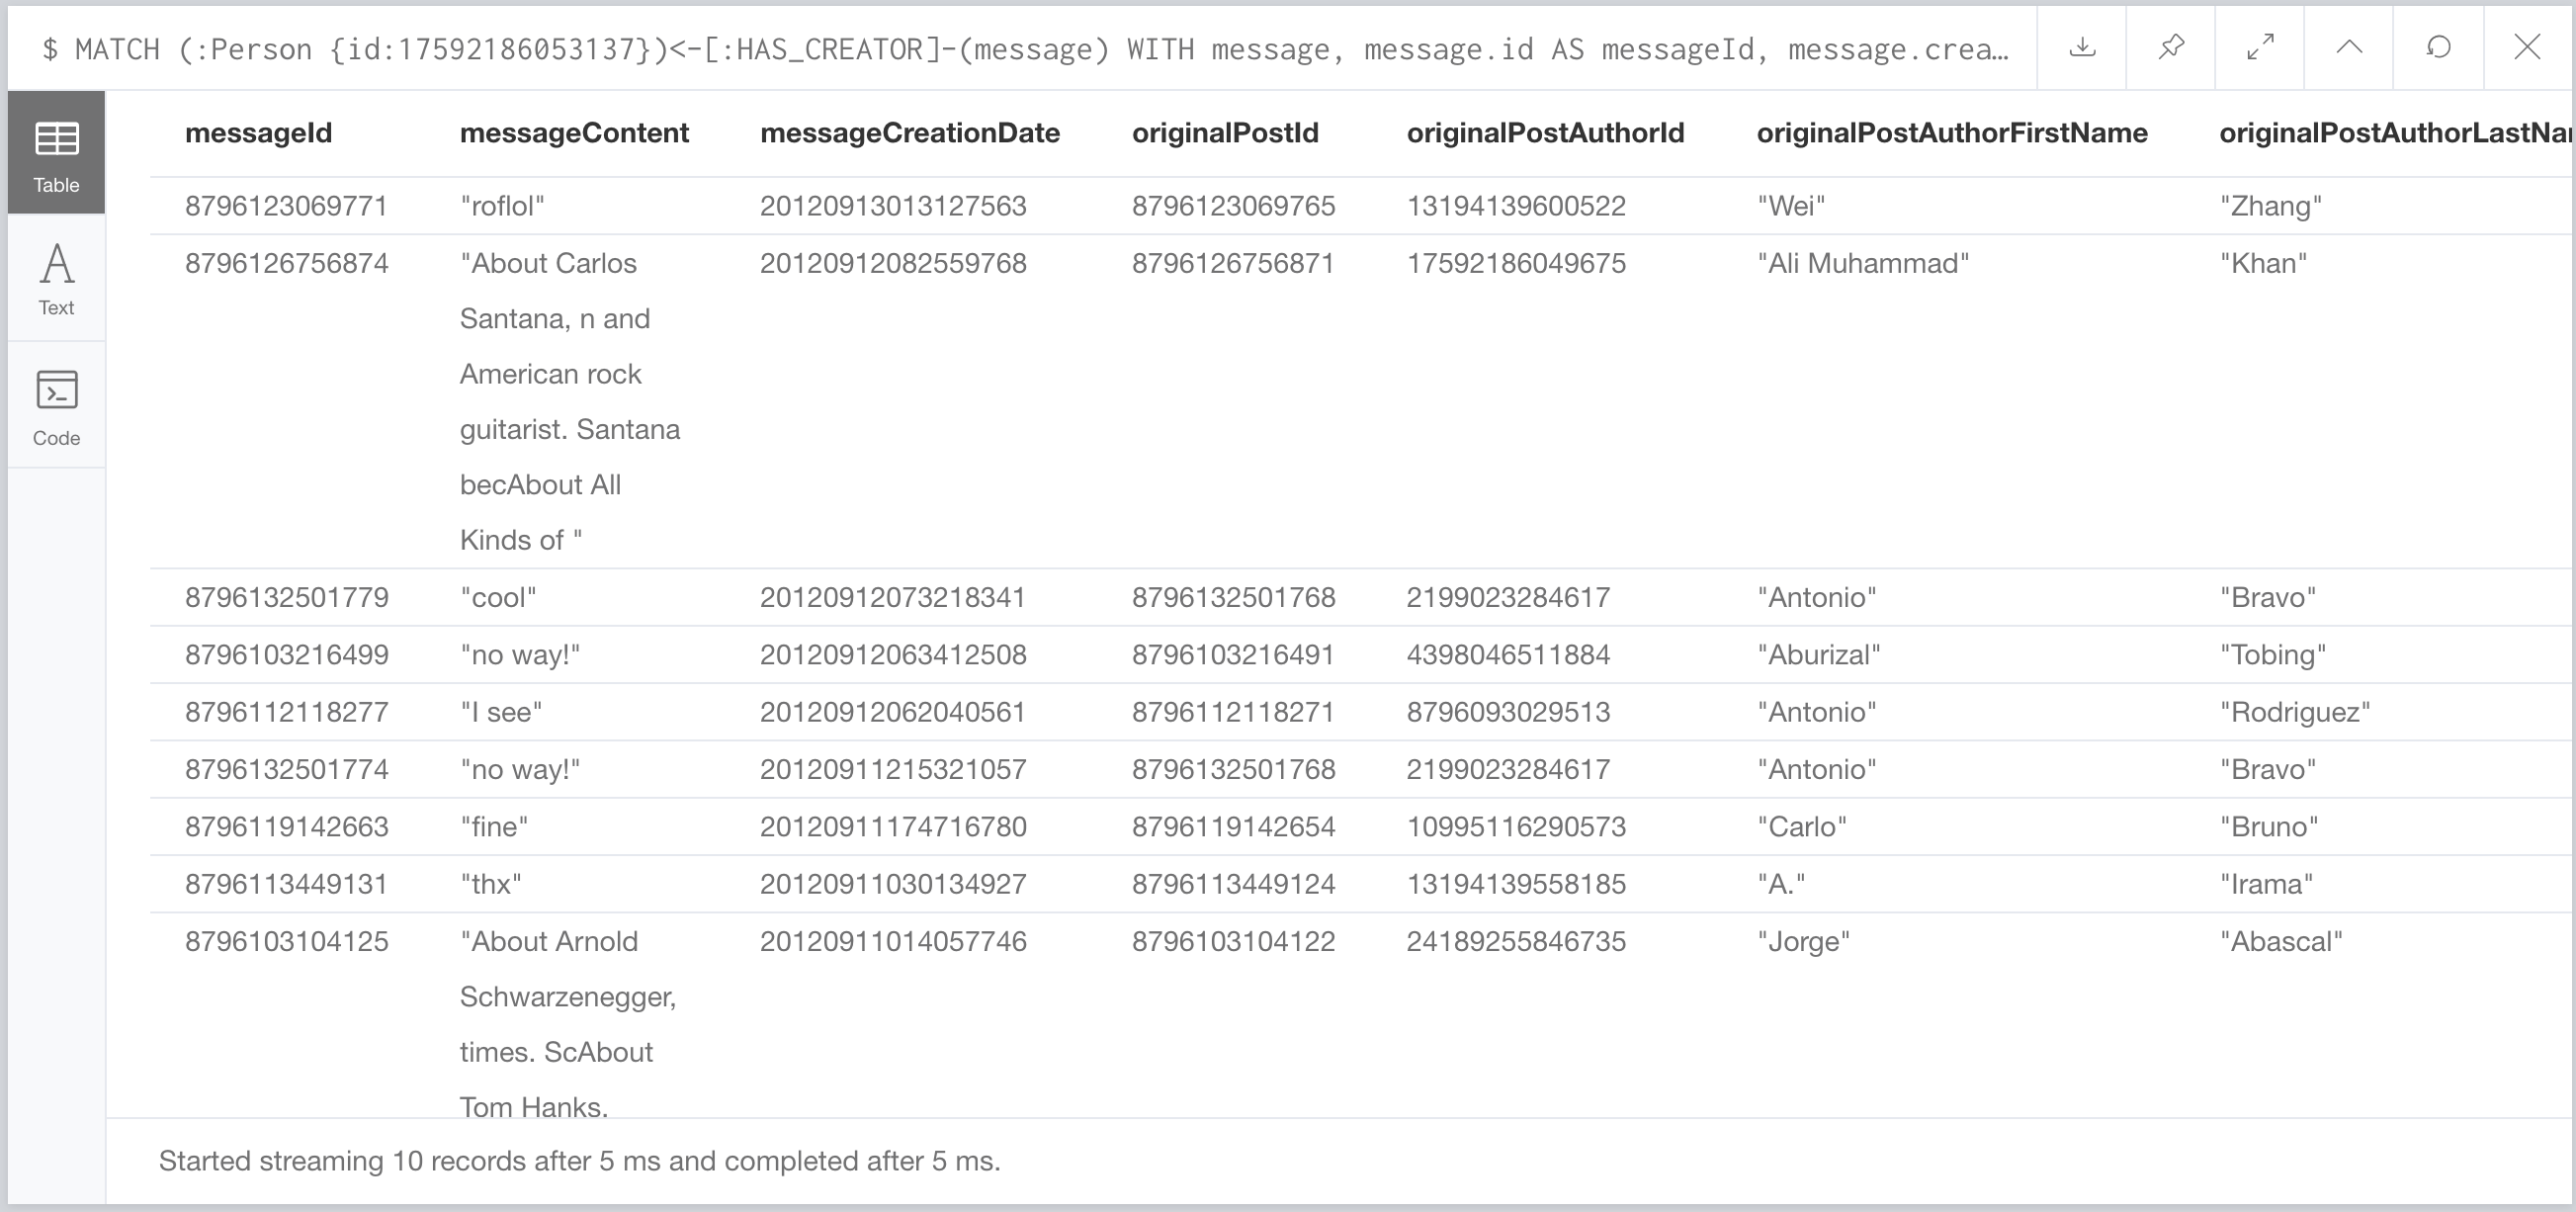
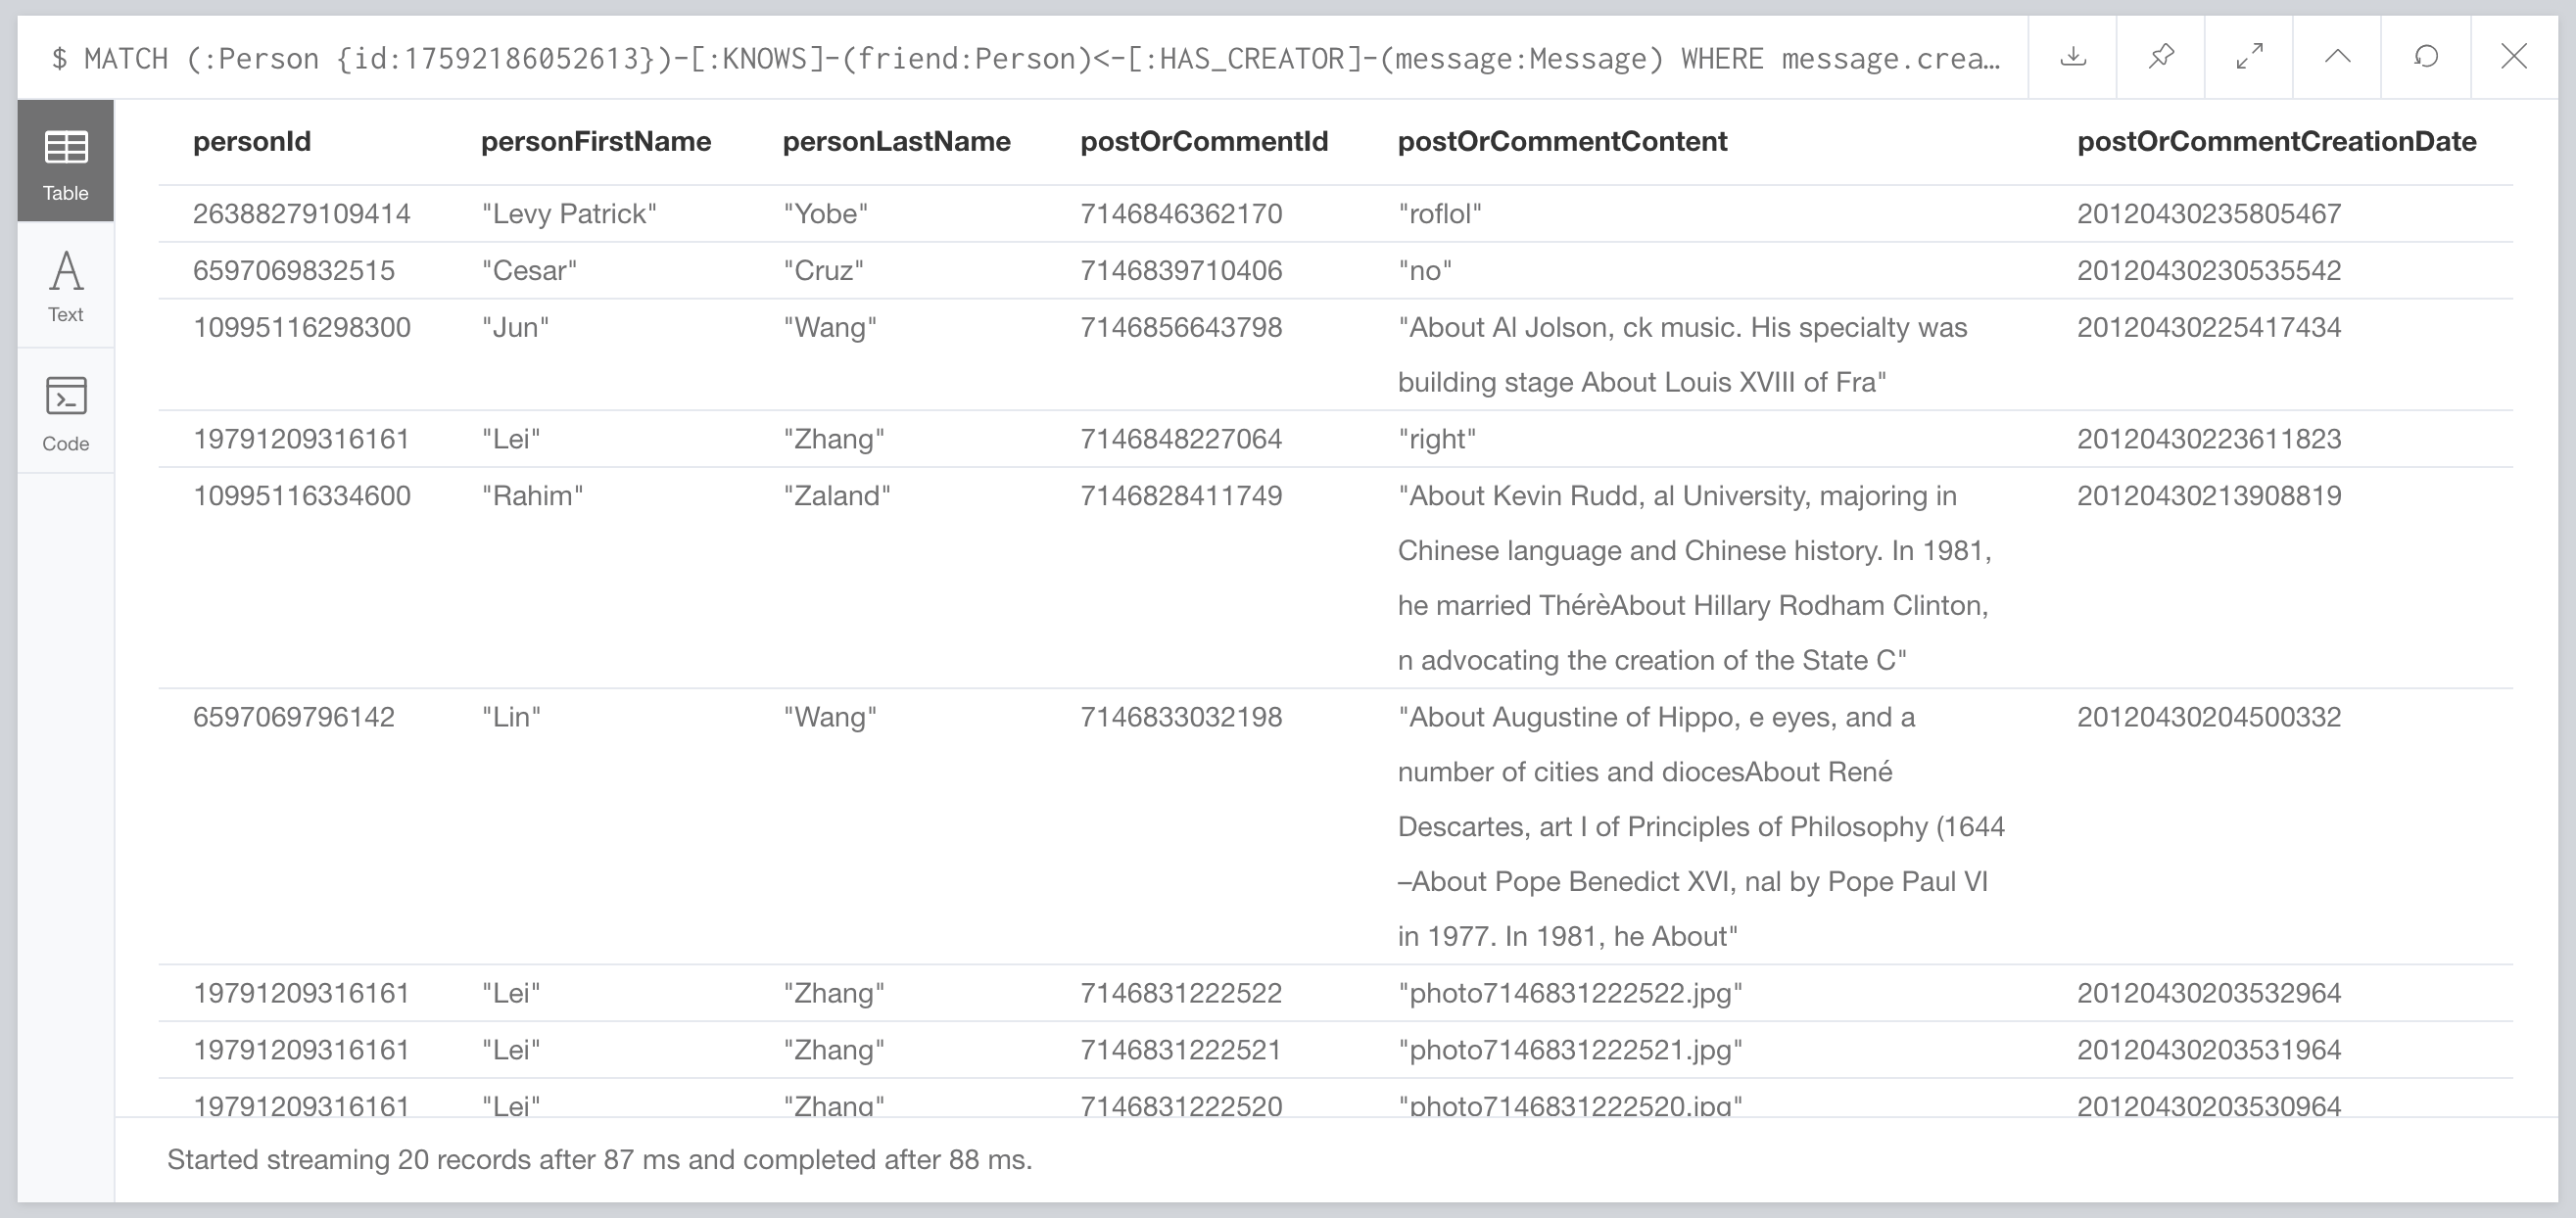
      MATCH (:Person {id:17592186053137})<-[:HAS_CREATOR]-(m:Message)-[:REPLY_OF*0..]->(p:Post)
      MATCH (p)-[:HAS_CREATOR]->(c)
      RETURN
        m.id as messageId,
        CASE exists(m.content)
          WHEN true THEN m.content
          ELSE m.imageFile
        END AS messageContent,
        m.creationDate AS messageCreationDate,
        p.id AS originalPostId,
        c.id AS originalPostAuthorId,
        c.firstName as originalPostAuthorFirstName,
        c.lastName as originalPostAuthorLastName
      ORDER BY messageCreationDate DESC
      LIMIT 10
We are supposed to get 96.51ms. Let’s run it a couple of times and see what we get:

29ms. That’s a third of what they got… but that query is written a bit weird. Let’s try it a different way:
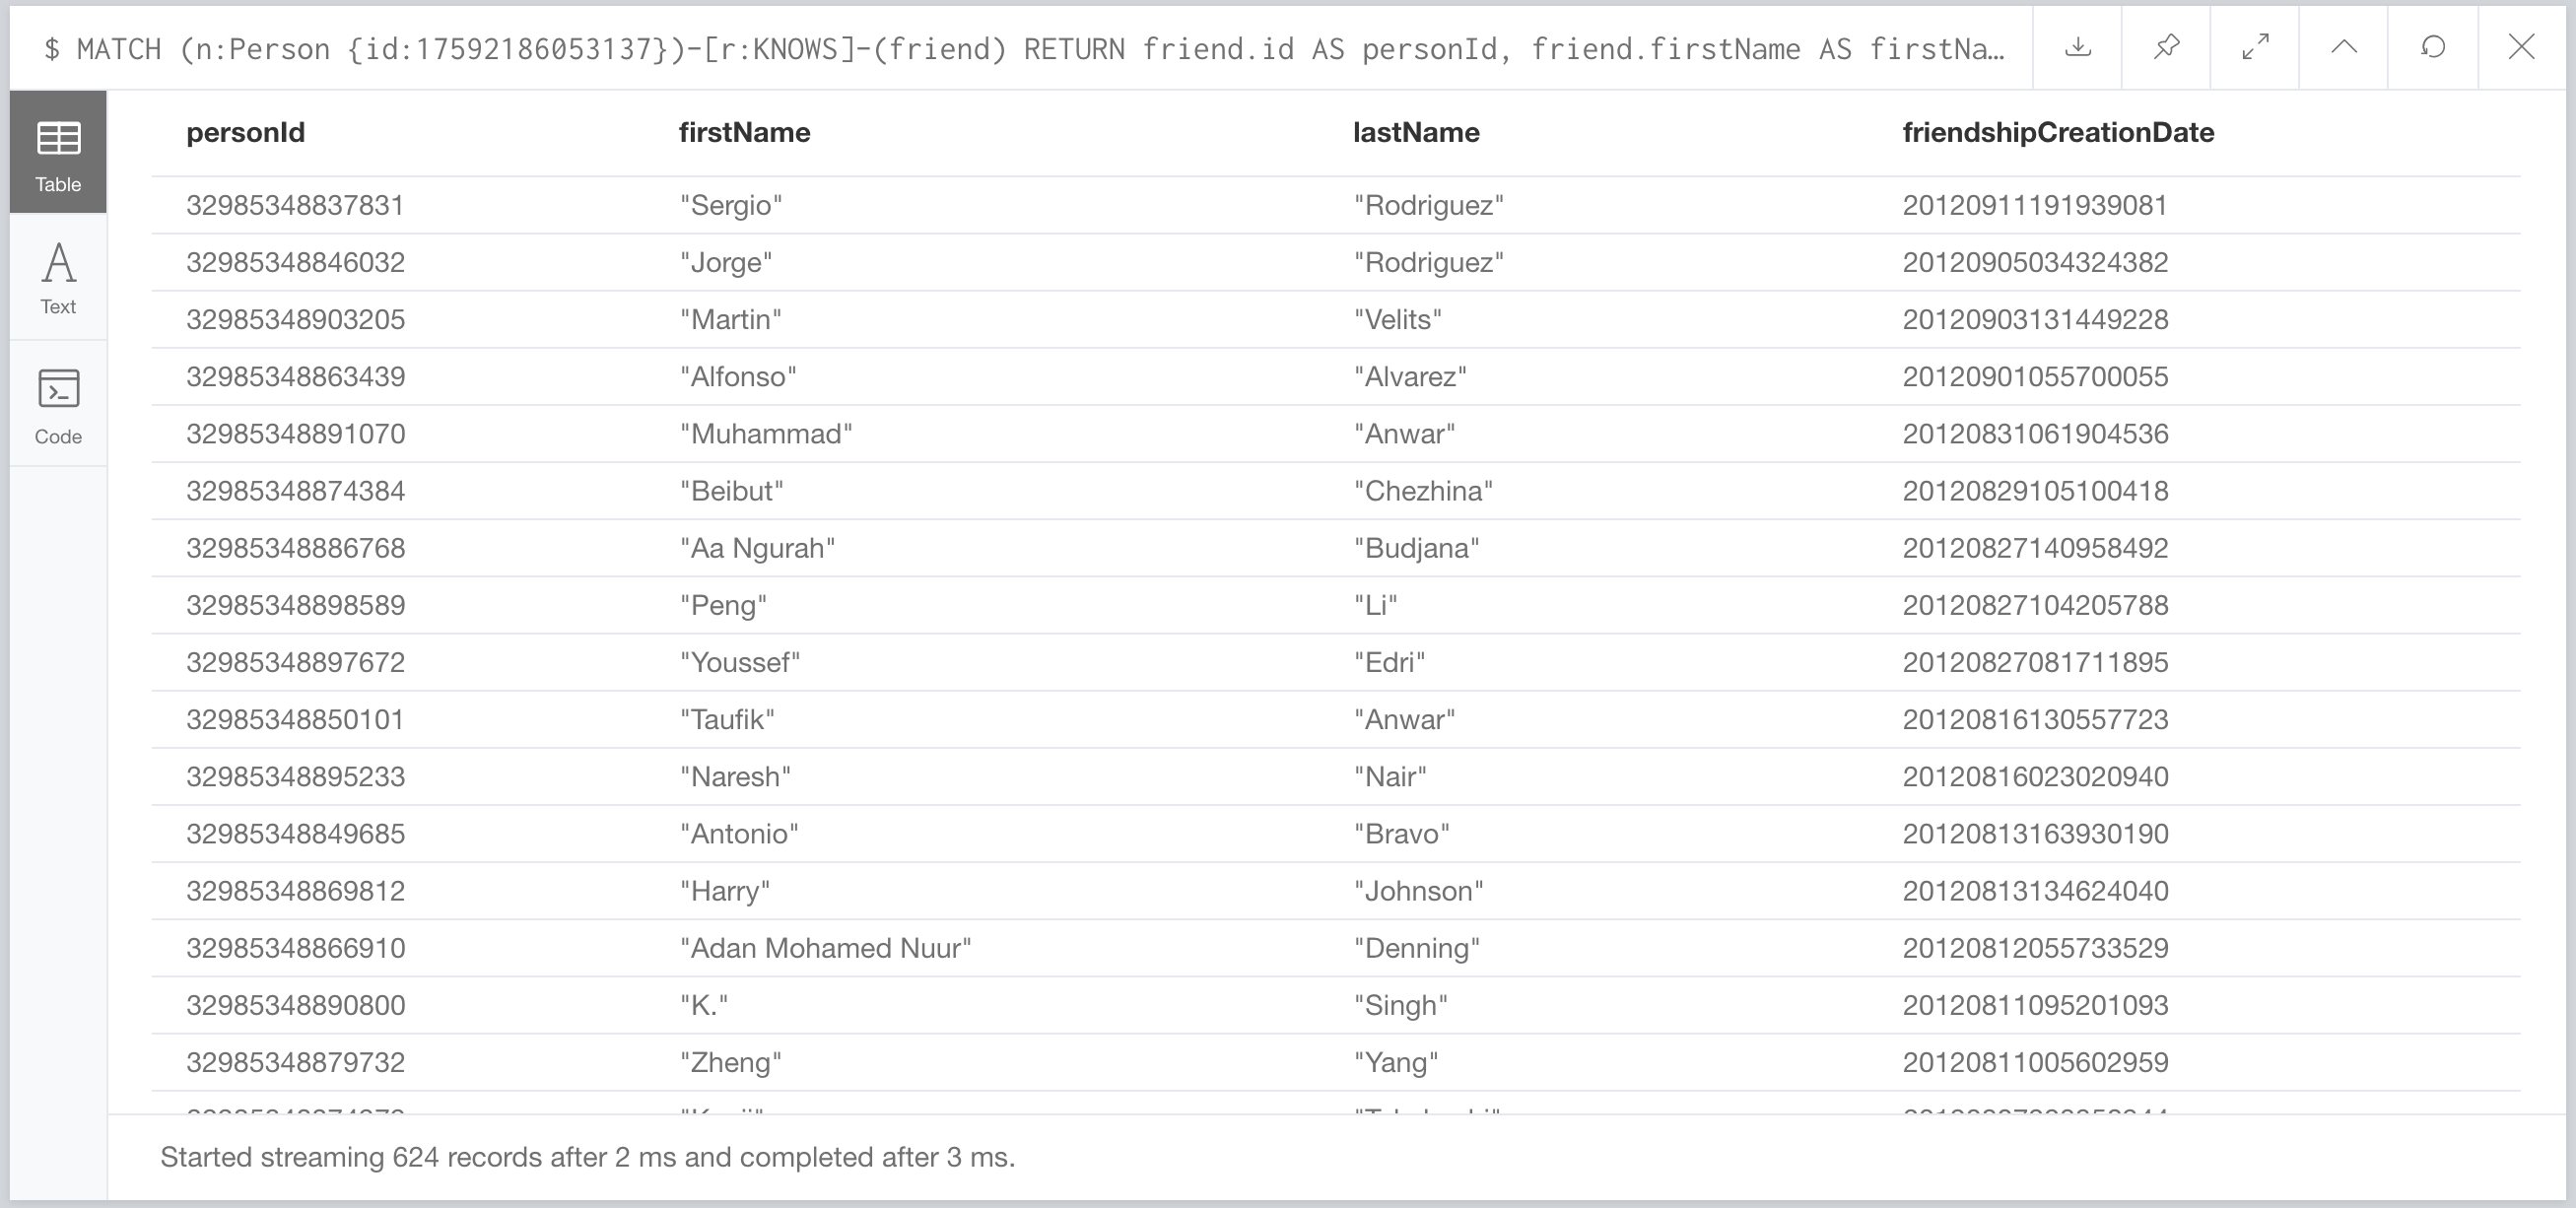
      MATCH (:Person {id:17592186053137})<-[:HAS_CREATOR]-(message)
      WITH message, message.id AS messageId,
           message.creationDate AS messageCreationDate
      ORDER BY messageCreationDate DESC, messageId ASC
      LIMIT 10
      MATCH (message)-[:REPLY_OF*0..]->(post:Post),
            (post)-[:HAS_CREATOR]->(person)
      RETURN
       messageId,
       COALESCE(message.imageFile, message.content) AS messageContent,
       messageCreationDate,
       post.id AS originalPostId,
       person.id AS originalPostAuthorId,
       person.firstName AS originalPostAuthorFirstName,
       person.lastName AS originalPostAuthorLastName
      ORDER BY messageCreationDate DESC, messageId ASC
…and if we run it a few times, what do we get:
5ms. Just 5ms. Which is faster than the 15.85ms their query put up. This Cypher query is 16 lines, and part of that is because of all the aliasing of the results. Their query is over 200 lines of code. Let me repeat that… Their query is over 200 lines of code. Let’s run our better query through Gatling:

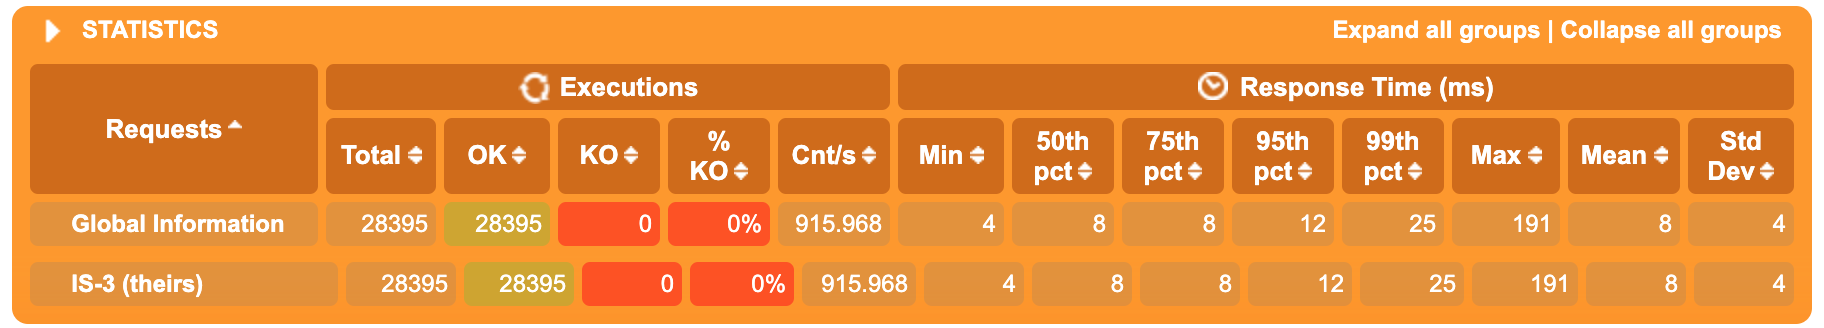
872 successful requests per second with a mean latency of 9ms. If you went with their numbers you would think Neo4j could only handle 10 requests per second on their 16 core machine. Ok, it could be another error, unlike the old saying, lightning can strike any location more than once. How about the third query?
What? 3ms? What? It says on this published research report that it’s supposed to take 69.70ms. Come on… Gatling?
Should we keep going? No. Ok, you had enough of these short queries? Let’s try the other set of queries called “Interactive Complex” (IC for short).
Let’s look at the first complex query:
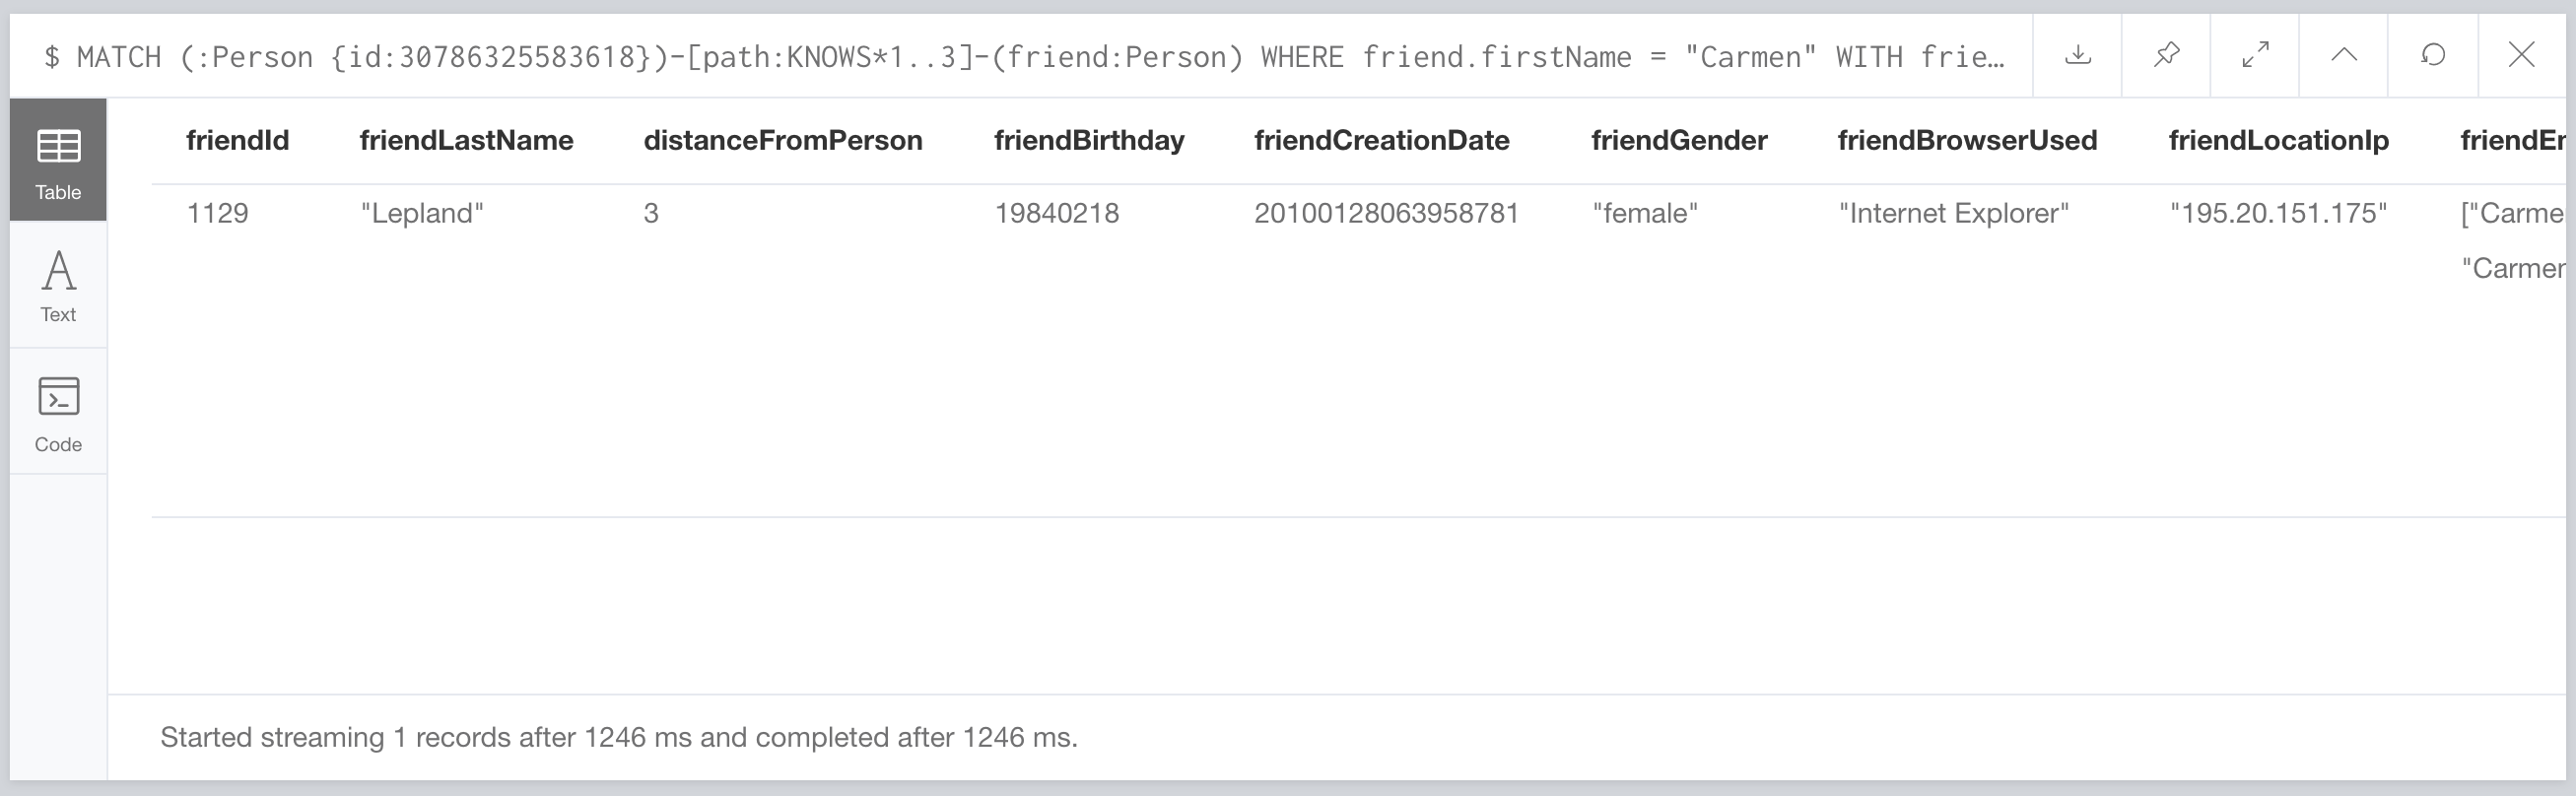
This one took 1246 ms. Better than the 4.25 seconds they reported, but it’s still slow. What does the query look like?
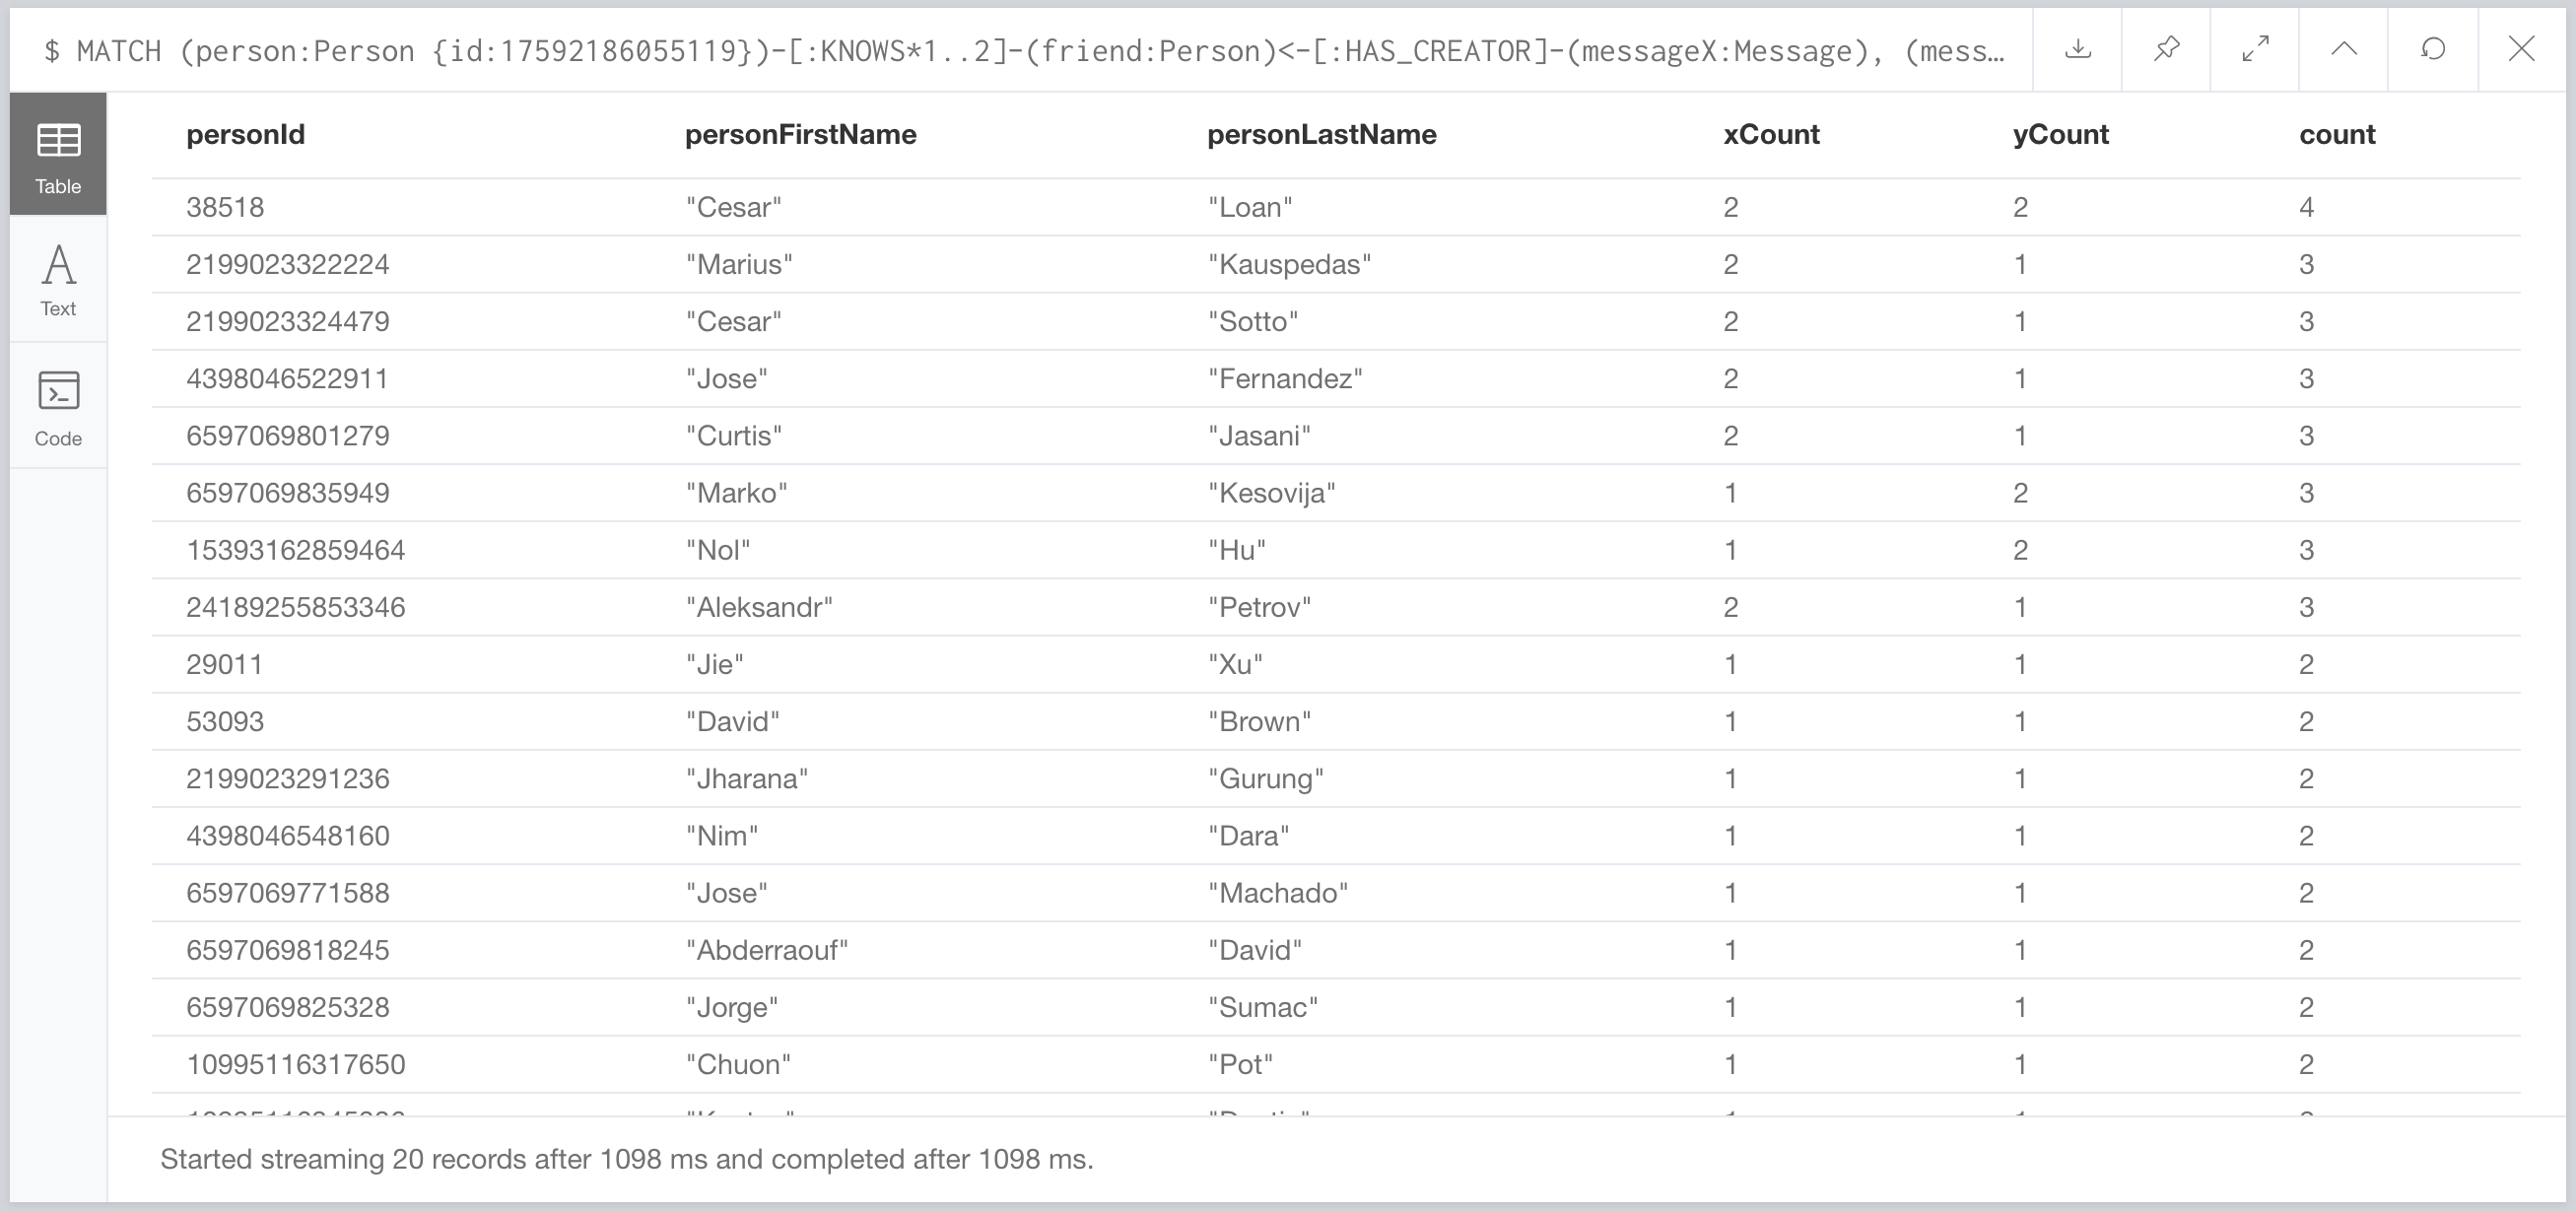
      MATCH (:Person {id:30786325583618})-[path:KNOWS*1..3]-(friend:Person)
      WHERE friend.firstName = "Carmen"
      WITH friend, min(length(path)) AS distance
      ORDER BY distance ASC, friend.lastName ASC, toInteger(friend.id) ASC
      LIMIT 20
      ...
Oh look. It uses a search lookup on Person(firstName). Surely they created an index on this property when they built the graph right? Nope. Ok. We’ll add it and try it again.
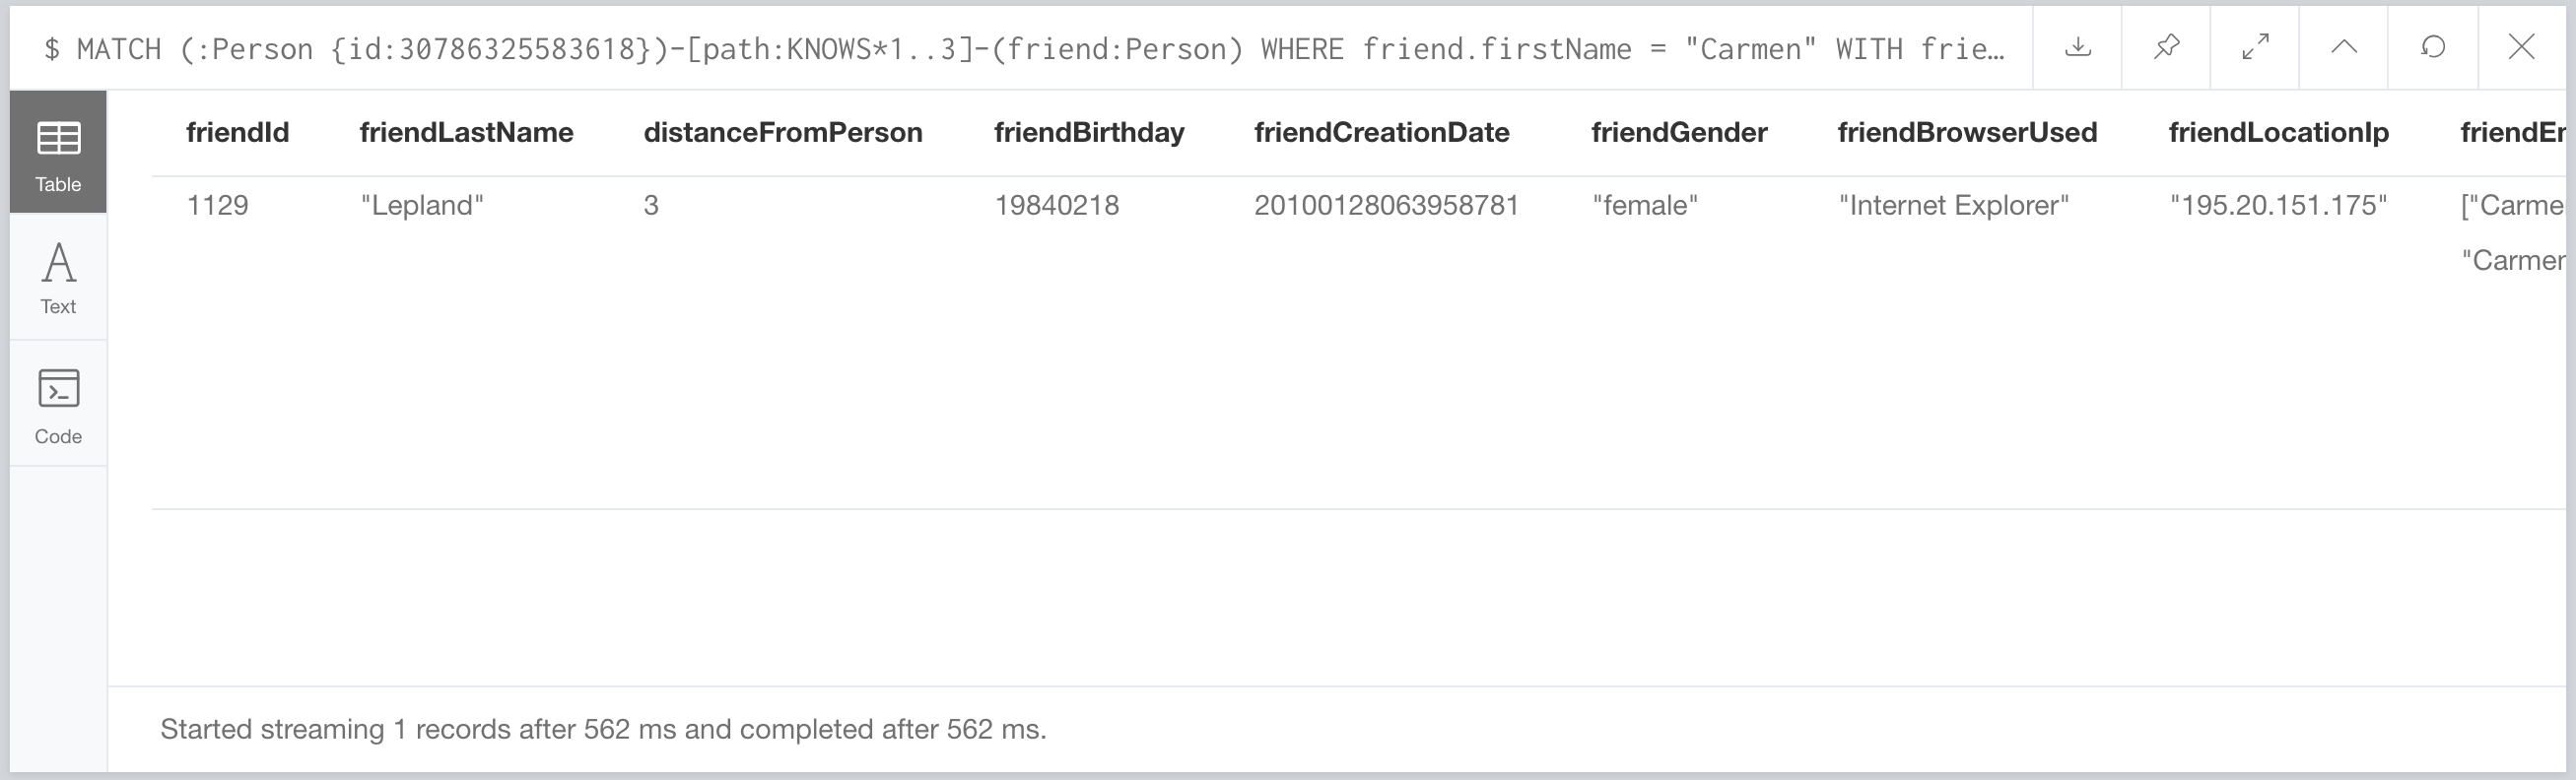
562ms? That’s a bit better, but it’s still kinda slow. What if we rewrote the query to be more efficient?
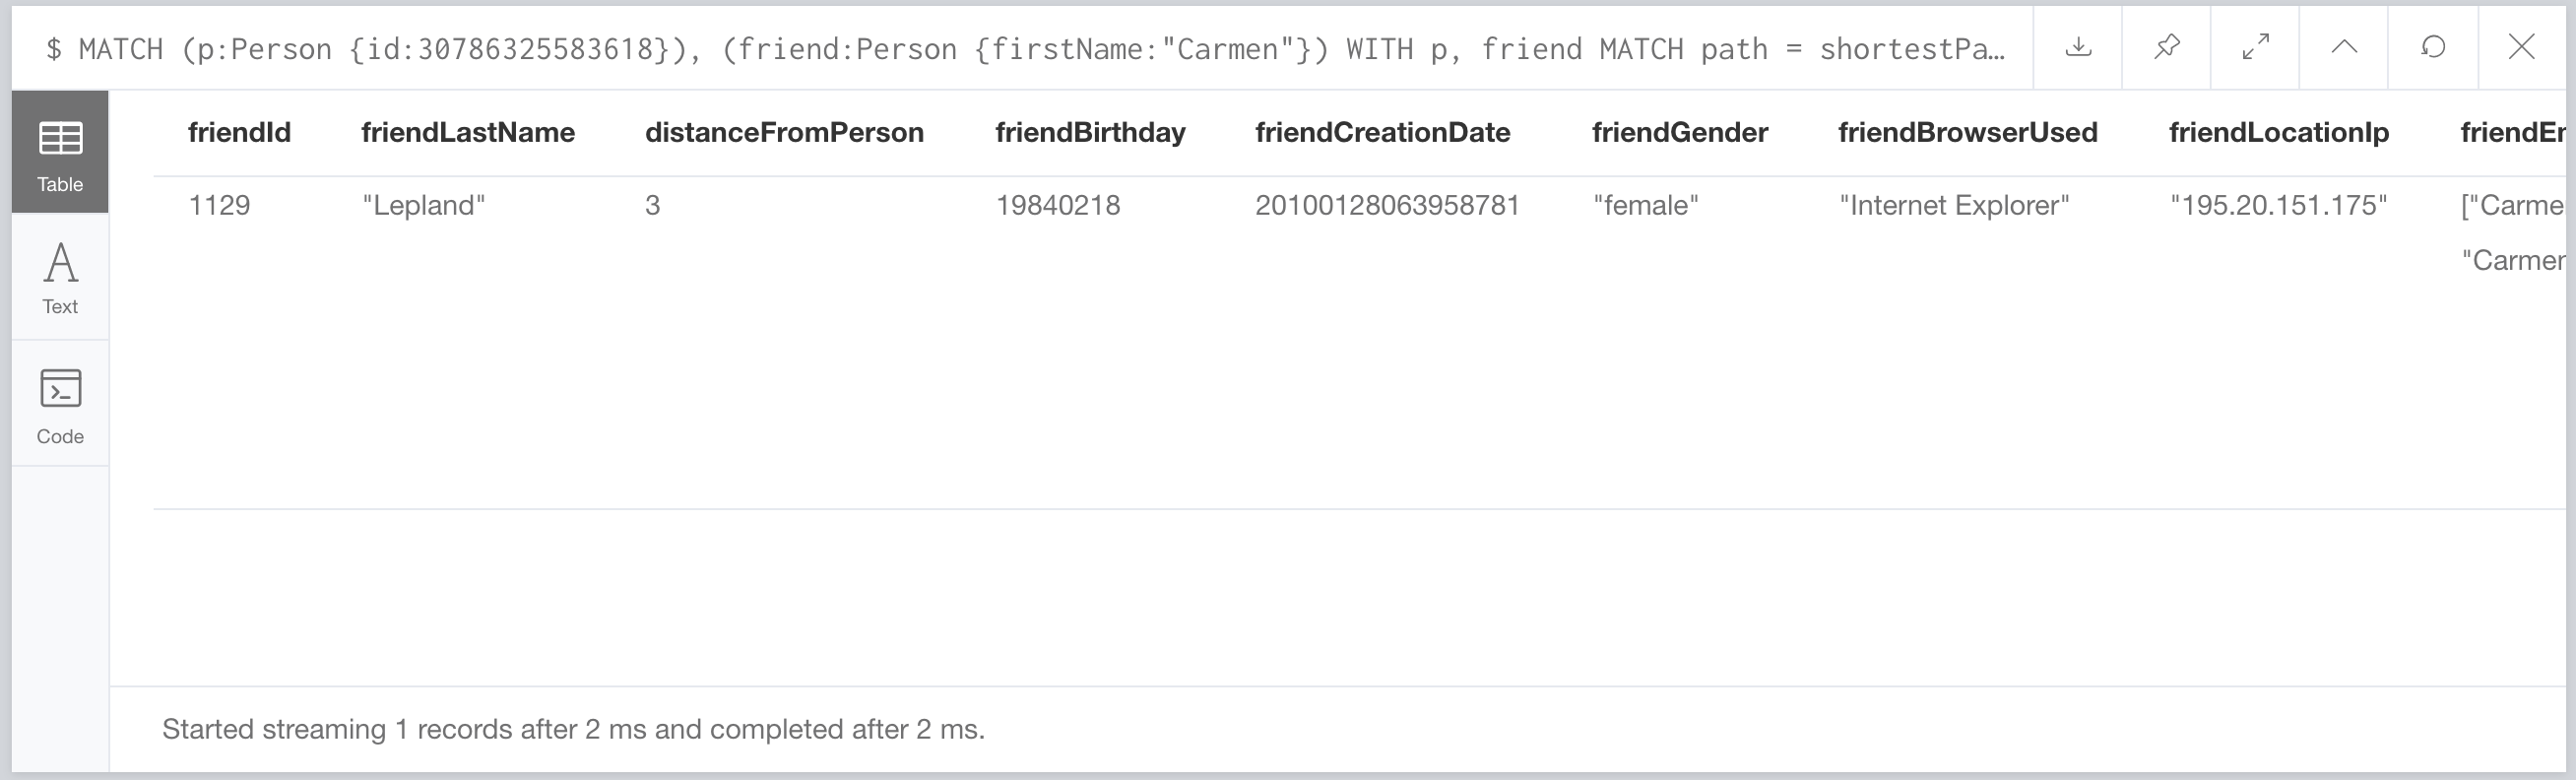
2ms. TWO MILLISECONDS. That’s a whole lotta order of magnitudes better than 4.25 seconds. Gatling?
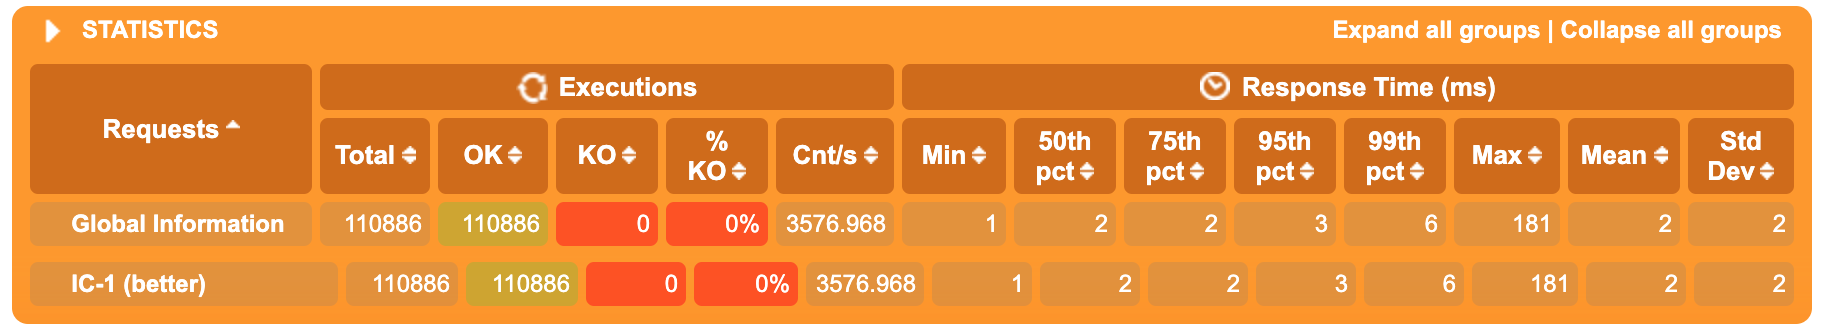
It’s 3 Strikes and you’re out, but you can keep hitting foul balls all you want. Let’s try the second complex query. We are supposed to clock in at 154 Seconds. That is in Seconds. What do we actually get:
88ms. What? How? Wut? How do they have us at 154 seconds, and we come in at 88ms? It doesn’t make any sense. Gatling?
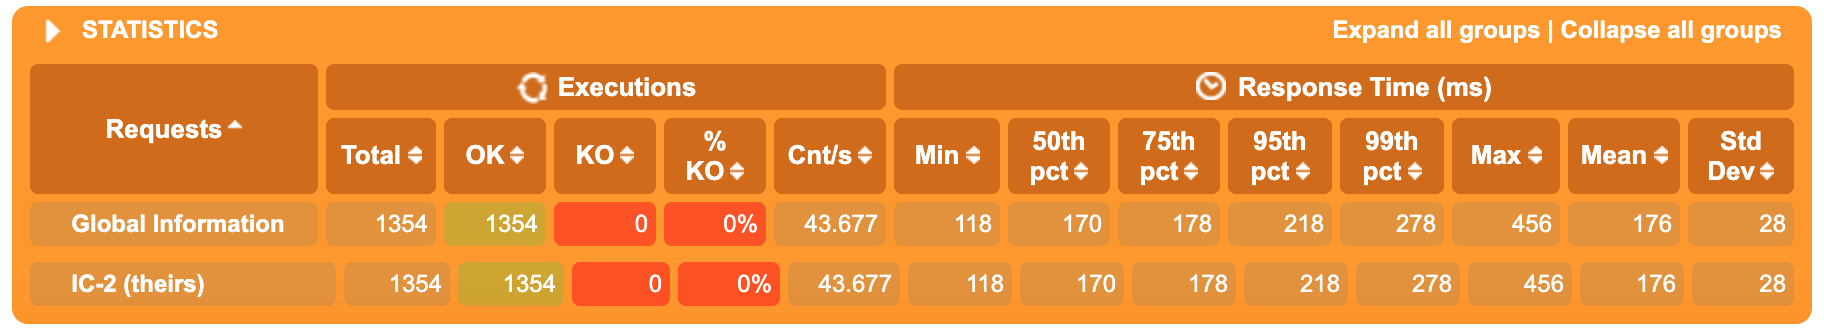
If you believed their report, Neo4j just wouldn’t be able to handle this query at all. Gatling shows us we can run 43 successful requests per second with a mean latency of 176 on this 5 year old 4 core laptop. How about the third query?
It’s supposed to take us over 8 seconds, but here it returns in about 1 second. We can do something weird and invert the query, getting the friends and then the messages of the two country nodes. This works great for countries with a small number of messages, but won’t work so well for others. This “inverted” query takes about 250ms which is faster than the other vendor. But how did they do it? Regular way or did they use these parameters as a special case and inverted the query as well?
We don’t know. Because the benchmark was put on github in order to “encourage reproducibility”, except they posted the Neo4j queries, and only a few of the other vendor queries. They posted no results, so we can’t be sure of anything.
I know what you are thinking. Isn’t a rebuttal of a vendor benchmark almost the same as doing your own vendor benchmark? You want to see some results where Neo4j loses right? That would be fair? It is. Neo4j loses in the “Business Intelligence” queries. Community edition doesn’t have the capabilities to make it a fair fight using Cypher. But we can use Neo4j Stored Procedures in the community edition. So I built one for the “BI-7” query in which we “time out”. It’s not really fair to call it a query, since it’s more of a report. The kind of workload you run rarely, not many times per second.
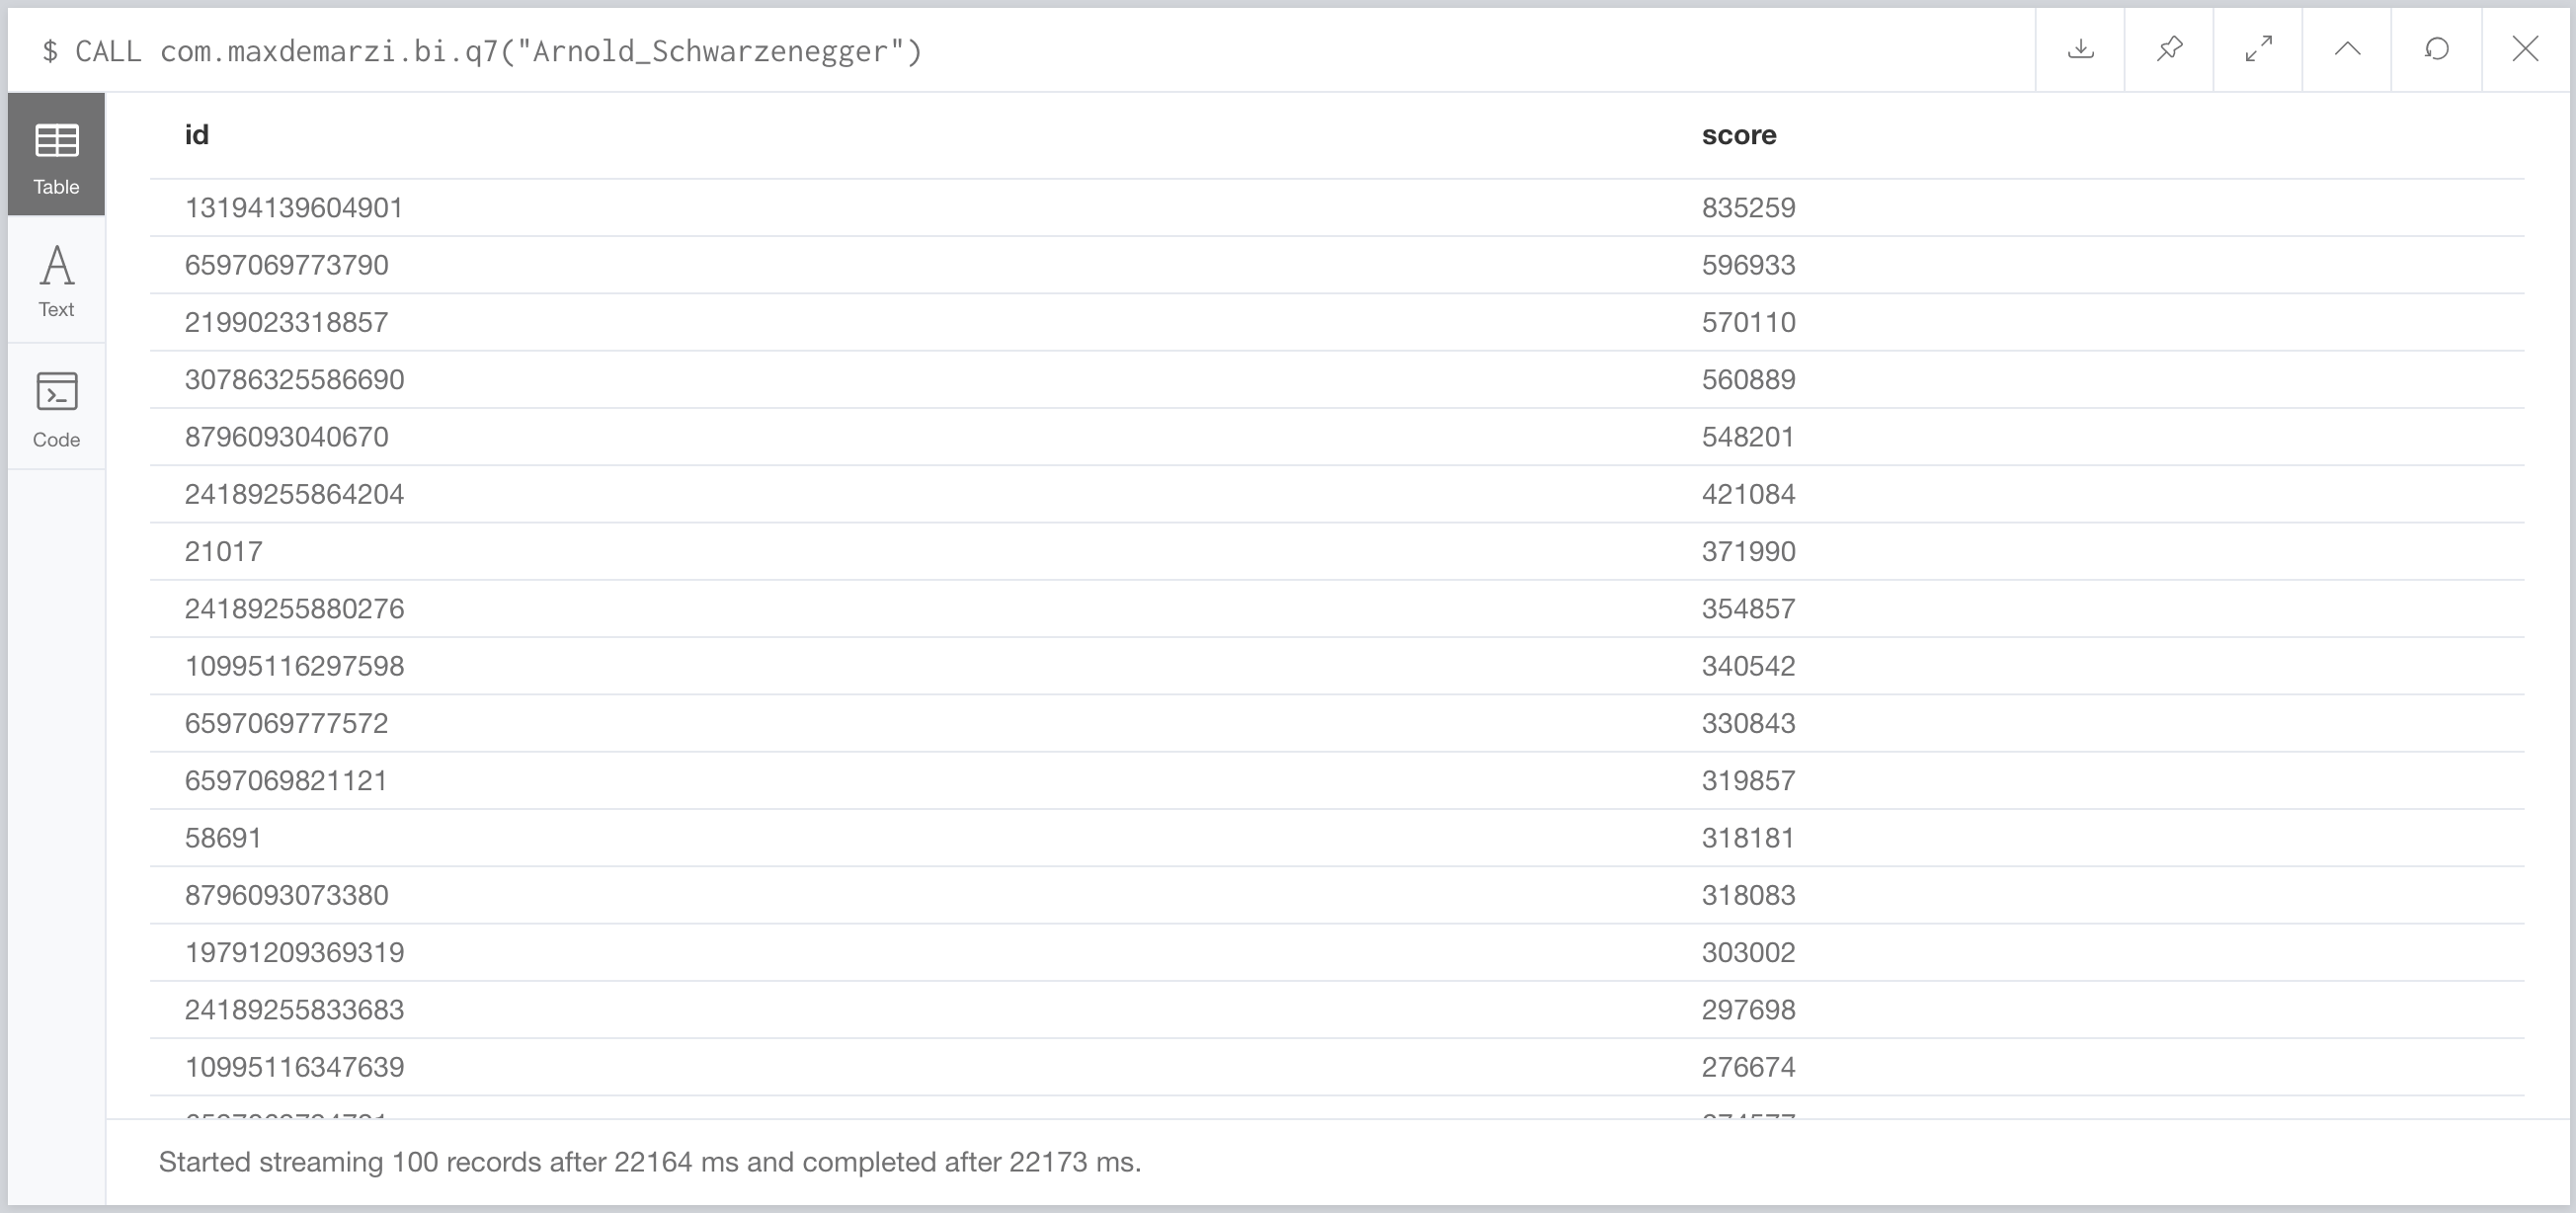
With the Stored Procedure we don’t time out after 5 hours, instead it takes us 22 seconds vs their 5 seconds. We lose that one, but what we don’t lose is customers. We take pride in our customer renewal rate and do our upmost to make sure your graph projects go from proof of concept to production successfully. So if you are tired of this nonsense and ready to get started, get in touch and we’ll help you get there.
The source code is available on github as always, and in case you missed it here is the BI-7 stored procedure as well.

Awesome, Max!
Thanks Max – really good stuff
Fantastic post, well done.
Extremely helpful