
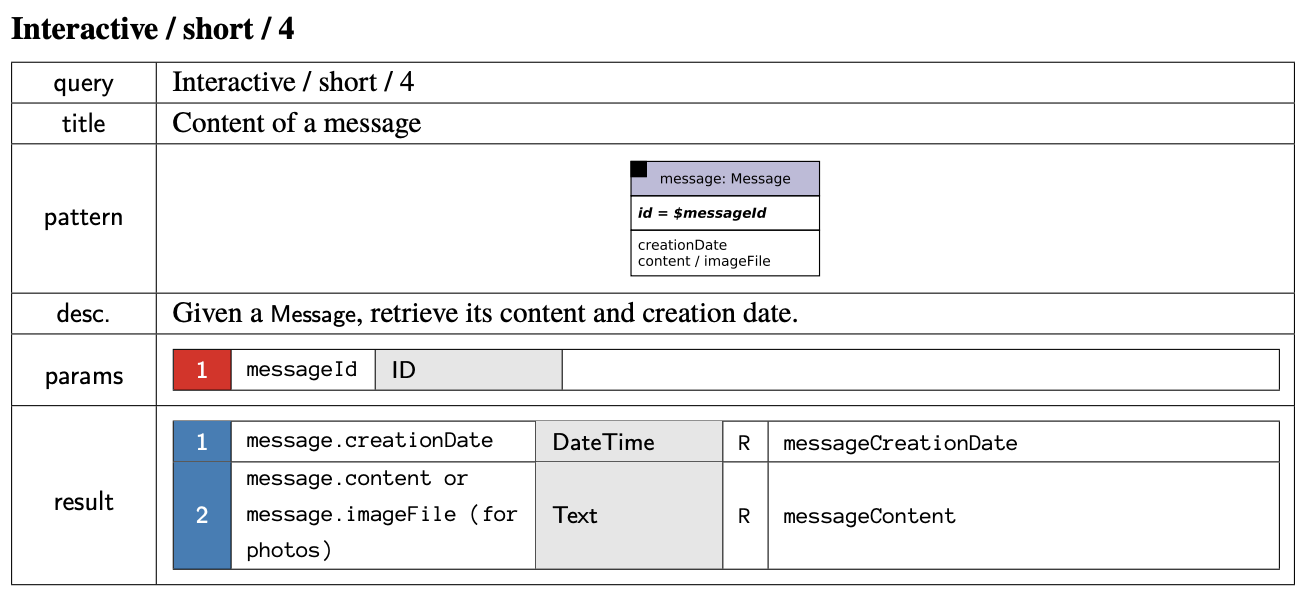
I’m still trying to figure out the right look for the language folks will use to talk to RageDB. Instead of waiting until I have it figured out, I decided I should write all the queries for the LDBC SNB Benchmark to prepare for a full run in the next few months. Now that we added “stored procedures” to RageDB, the benchmark code is trivial. I send a post request to the Lua url with the name of the query plus any parameters it may need which are in a CSV file. Here is Short Query 4 for example and they all look like this besides the different parameters:
  def request: HttpRequestBuilder = {
    http("LDBC SNB IS 04")
      .post("/db/" + params.rageDB + "/lua")
      .body(StringBody("""ldbc_snb_is04("#{post_id}")""".stripMargin))
      //.asJson
      .check(status.is(200))
  }

  val scn: ScenarioBuilder = scenario("rage.ldbc.snb.is04")
    .during(params.testDuration) {
      feed(csvFeeder)
        .exec(request)
    }
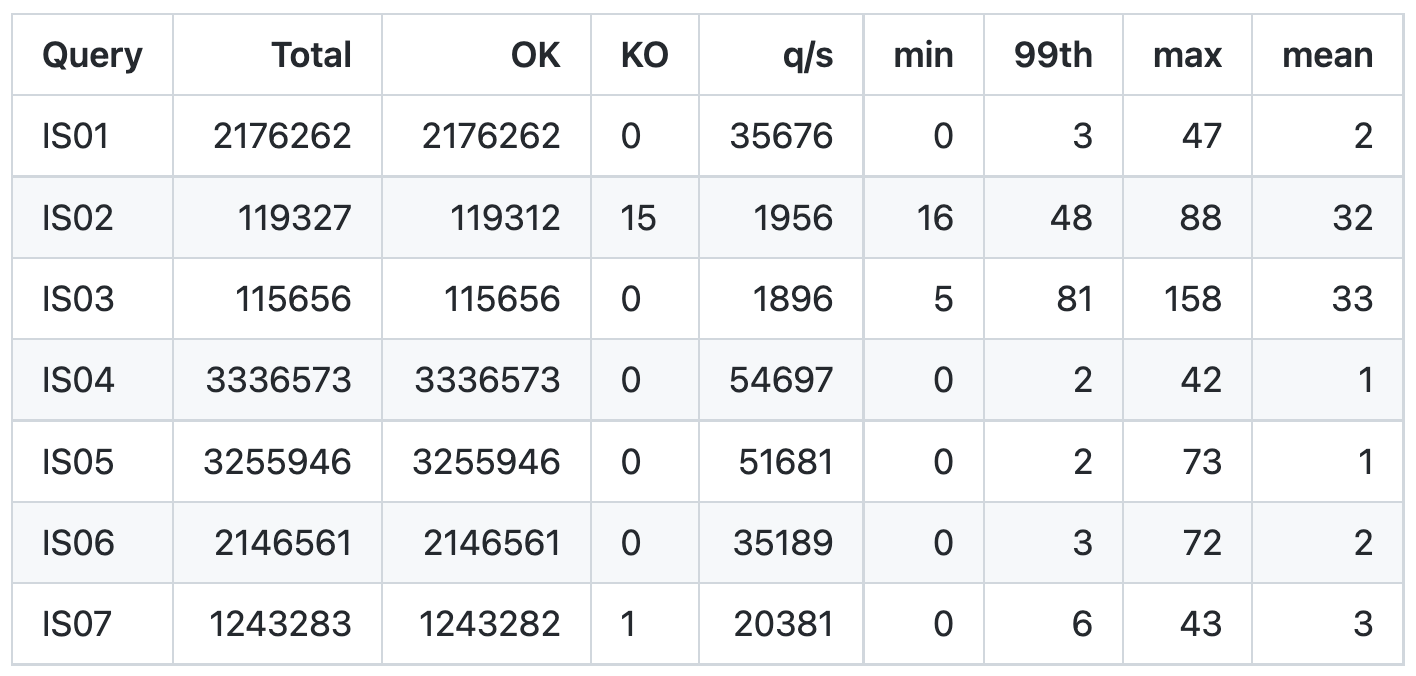
I’ve photoshopped the results from Gatling into a single image to make them easier to compare together:
At the top end of requests per second, we get LDBC SNB IS 04 with 54,697. Next is IS 05 not far behind. That is because these two queries are really simple. IS 04 just returns a Message node. IS 05 returns some attributes of the Person that created a message.
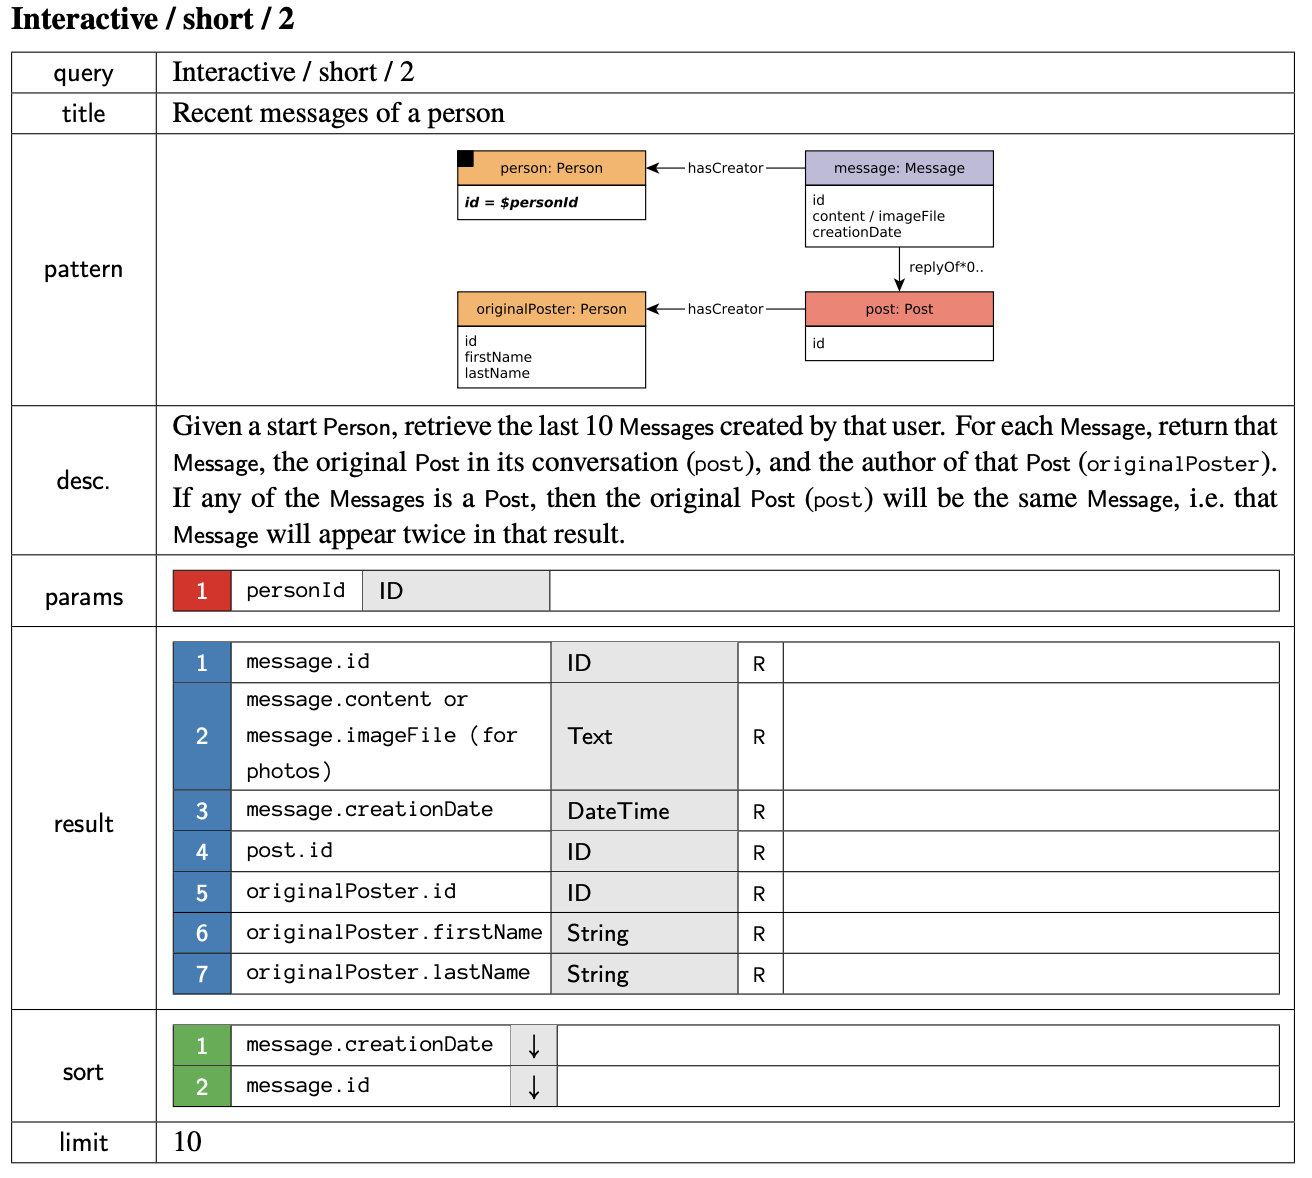
At the bottom of the requests per second, we get LDBC SNB IS 02 and 03. When we take a look at IS 02, we can see that it does much more work than 04 and 05. It starts at a person node, then retrieves the last 10 messages that person created and the author of the Post which could be that themselves or it may be someone else if that message was a Reply of a Post or a Reply of a Reply of a Reply, you get my point:
So it makes “perfect” sense that some queries would be slower than others, since they do more work. However, I looked at the current #1 standing on the benchmark TuGraph and noticed something a bit odd on page 10 of their audited results:

The 7 short queries are almost all instantaneous. Those response times are in microseconds. So a mean of 1519.34 is really 1.5ms. The astute observer will notice the min, max and p99 are extremely far away… this points to a coordinated omission problem. Somewhere out there Gil Tene just felt a disturbance in the force. But more on that later. First let’s figure out how in the world they got all their queries to reply at pretty much the same time even though they do wildly different amounts of work. Let’s look at the number 2 graph database, GalaxyBase and their results:
Would you look at that… their mean times are faster than TuGraph. But for whatever reason they ran a whole lot less queries. If we look at the individual query mean times, we see IS 02 and IS 03 are both slower than the rest as expected. I’ll paste the current RageDB numbers here so you don’t have to scroll up:
Keep in mind both TuGraph and GalaxyBase results are for SF30 and RageDB is showing just SF01, and on wildly different hardware so it is not apples to apples. But both GalaxyBase and RageDB have similar differences in runtimes for the different queries vs all the same for TuGraph. So what’s the reason?
> 7.4.3 Precomputation: Precomputation of query results (both interim and end results) is allowed. However, systems must ensure that precomputed results (e.g. materialized views) are kept consistent upon updates.
LDBC SNB Specification
It seems TuGraph is probably precomputing the results ( I don’t know, it is not mentioned in the audited report or I missed it). But isn’t it weird that they managed to be 10 times slower on the mean of these queries vs GalaxyBase but still come out on top? Maybe it’s because GalaxyBase maxes are insane. If your mean is 78 microseconds and your max is 137,800 microseconds something is clearly wrong.
That is called coordinated omission. We talked about this previously a while ago. Here are two sets of numbers. In one RageDB is going 190k requests per second, in the other we push it to 195k req/s. Notice in the 190k column the 50% and 99% times are fairly close, even the max is “reasonably close”. Now look at the 195k column and the 99% is 40 times slower than the 50% which is 25 times slower than the 50% at 190k. This means we’ve pushed the system too far and it is falling over. In the real world, we would not be meeting the expected “service level agreements” in our response times.
        190k req/s  195k req/s
 50.000%    1.23ms     25.55ms
 75.000%    1.60ms    242.69ms
 90.000%    1.99ms    771.07ms
 99.000%    2.92ms      1.24s
 99.900%    5.84ms      1.37s
 99.990%    8.65ms      1.38s
 99.999%    9.88ms      1.39s
100.000%   11.09ms      1.40s
I’ve sent these observations to some of the folks in charge of the LDBC SNB Benchmarks, hopefully a few tweaks can be made to improve the benchmark. If you want to learn more about how to measure system latency watch this great talk from Gil Tene:

TuGraph uses two different machines as client and server, which adds around 200 microseconds latency for each request. That is why the min of each request is at least 200us. GalaxyBase, on the other hand, uses the embedded mode, which means the client and server runs in the same process. That explains the ultra-low min/mean latency.
Embedded? So not even using any networking what so ever. Not even loopback? That’s comparing apples and bananas then.
The SNB specification does not have any requirement regarding the use of network, so the GalaxyBase result is valid, though not a practical setup.