
“That a lie which is half a truth is ever the blackest of lies” — Alfred Tennyson. Before embarking on the journey of achieving something great, you are often told to imagine having already done it. This is the pseudo scientific belief that visualizing a positive outcome helps one achieve it. It propelled “The Secret” to sell 30 million copies worldwide. However, it isn’t the outcome we are supposed to be fantasizing about, but rather the execution of the actions required to accomplish our goal.
It’s much easier to fantasize about having the body of a Greek statue than the mind numbing months or years of consistent diet and exercise required to get that body. Building software can feel like this too. It’s a grind. Every once in a while though, you make enough progress that you start to see results. Let’ see some query results in RageDB.
I’ve loaded up the LDBC Social Network benchmark data and have this following query to run. It gets a person, their KNOWS relationships and their neighbors:
local person = NodeGet("Person", "17592186055119")
local knows = NodeGetRelationships("Person", "17592186055119", "KNOWS")
local neighbors = NodeGetNeighbors("Person", "17592186055119", "KNOWS")
person, knows, neighbors
When we run this query (or any other up to this point) all we’ve been greeted with it is this blob of JSON:

Wouldn’t it be nice to see the results in some kind of table or grid format? It would right? So I went looking for something to help us and ran into Grid.js

Let’s integrate it. We’re getting back an Array of adhoc JSON from the server. Let’s parse that JSON and handle it in a loop. Grid.js expects an Array, so if the value inside that array is not one, we wrap it in one.
            let json = JSON.parse(text);
             for (let index = 0, len = json.length; index < len; ++index) {
                 let table = json[index];
                 if (!Array.isArray(table)) {
                    table = [table];
                 }
In the query above we have 3 results. The first is the person, the second is the KNOWS relationships and the third is the neighbors at the other side of the KNOWS relationship. These are 3 different results, so we’ll create a grid for each one. Then we’ll flatten each one into table format grid.js can understand:
                let elemDiv = document.createElement('div');
                responseGrid.appendChild(elemDiv);

                // We need to flatten the result for the Grid
                for (let index = 0, len = table.length; index < len; ++index) {
                    table[index] = flattenJSON(table[index]);
                }
Nodes and relationships have some shared “meta” fields: an “id” field, and a “type” field. Nodes have a “key” while Relationships have a “starting_node_id” and “ending_node_id”. They both also have “properties” which hold the actual properties of both. The flattenJSON function is a recursive function that combines the meta fields and properties together into a table:
const flattenJSON = (obj = {}, res = {}, extraKey = '') => {
    for(let key in obj){
        if(typeof obj[key] !== 'object'){
            res[extraKey + key] = obj[key];
        }else{
            let nextKey = `${extraKey}${key}.`;
            if(nextKey === 'properties.') {
                nextKey = '.';
            }
            flattenJSON(obj[key], res, nextKey);
        }
    }
    return res;
};
After each result is flattened, we can create a grid for it and add it to the “div” we created earlier:
                let grid = new gridjs.Grid({data: []}).render(elemDiv);
                grid.updateConfig({
                    data: table,
                    search: true,
                    sort: {
                        multiColumn: false
                    },
                    pagination: {
                        enabled: true,
                        limit: 10,
                        summary: true
                    },
                    resizable: true
                });

                grid.forceRender();
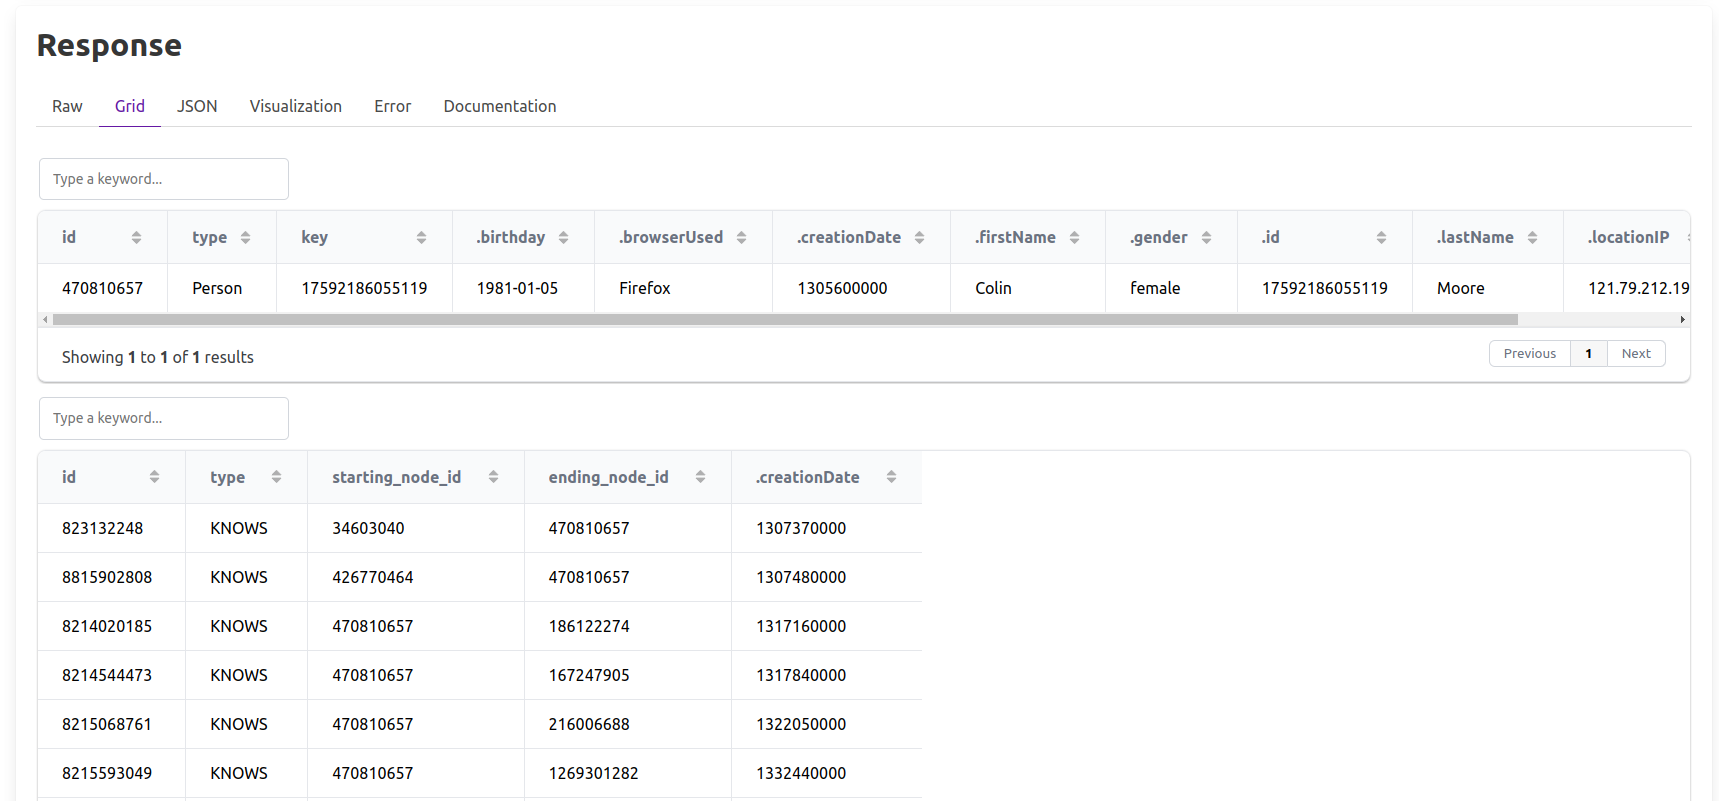
With that in place, when we run the query and head over to the “Grid” tab of the Response we can now see some great looking table results:
Not all results will be able to convert into tables and that’s ok. We can also take our “raw” text response and visualize it as pretty printed JSON.
let data = JSON.parse(text);
responseJson
.appendChild( document.createElement('pre'))
.innerHTML = syntaxHighlight(JSON.stringify(data,null, 2));
The syntaxHighlight function matches a regular expression and adds a “span class=xyz” to every field based on its type:
function syntaxHighlight(json) {
json = json.replace(/&/g, '&').replace(/</g, '<').replace(/>/g, '>');
return json.replace(/("(\\u[a-zA-Z0-9]{4}|\\[^u]|[^\\"])*"(\s*:)?|\b(true|false|null)\b|-?\d+(?:\.\d*)?(?:[eE][+\-]?\d+)?)/g, function (match) {
let cls = 'json-number';
if (/^"/.test(match)) {
if (/:$/.test(match)) {
cls = 'json-key';
} else {
cls = 'json-string';
}
} else if (/true|false/.test(match)) {
cls = 'json-boolean';
} else if (/null/.test(match)) {
cls = 'json-null';
}
return '<span class="' + cls + '">' + match + '</span>';
});
}
These span html elements get a little styling help and color in CSS :
#response-json pre {outline: 1px solid #ccc; padding: 3px; }
#response-json .json-string { color: green; }
#response-json .json-number { color: royalblue; }
#response-json .json-boolean { color: darkred; }
#response-json .json-null { color: magenta; }
#response-json .json-key { color: rebeccapurple; }
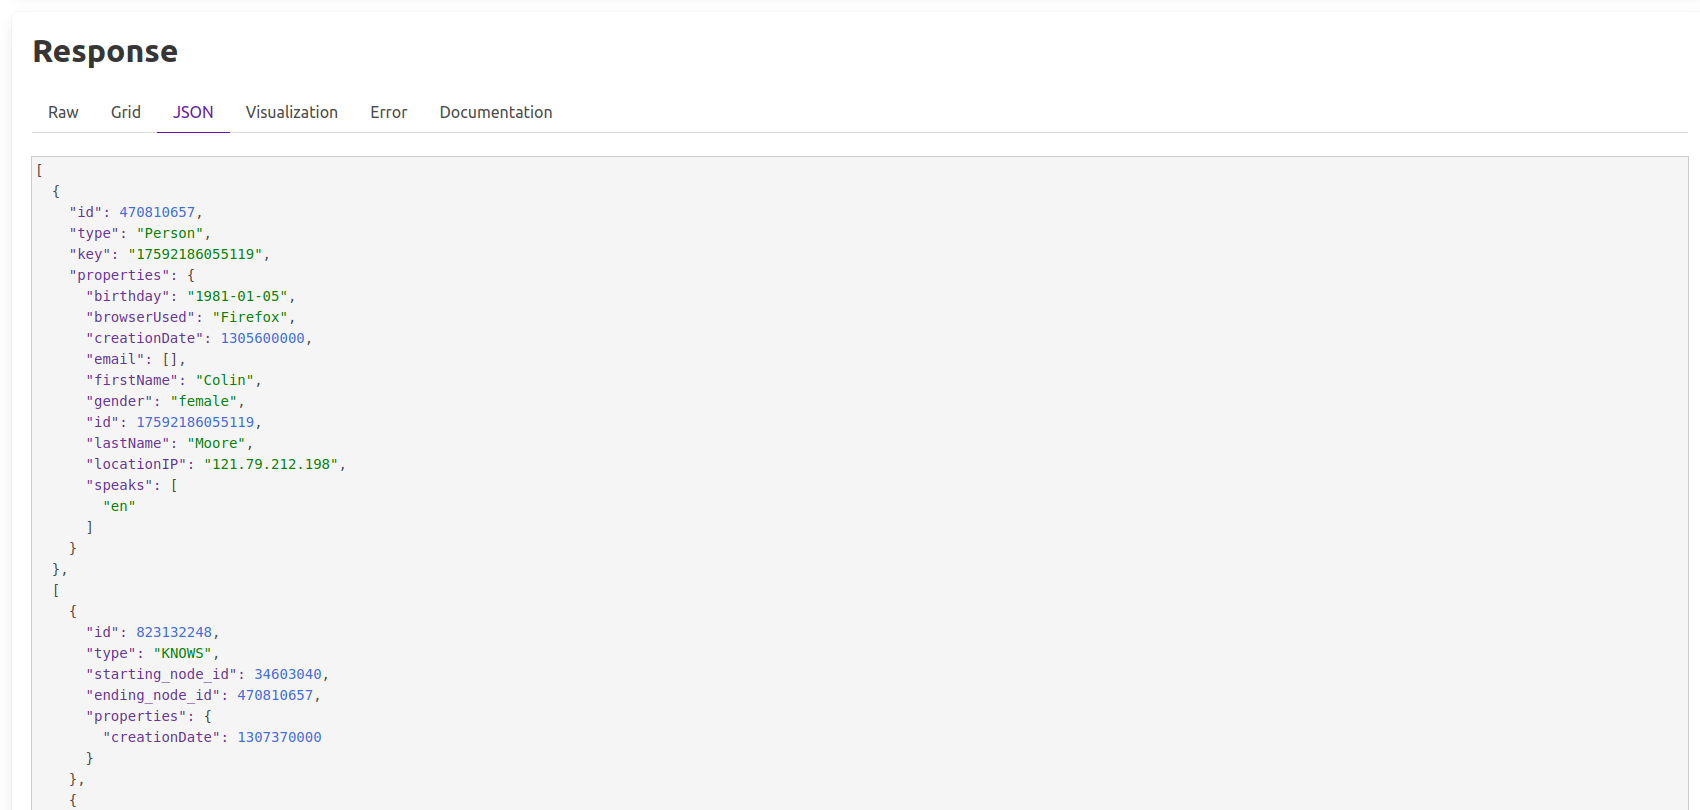
Which then gives us this JSON output using our favorite purple for the field names:
Finally comes the graph visualization. There are a ton of libraries to choose from but I went with force-graph from Vasco Asturiano. He also built a globe visualization library we can add once we have geo-spatial capabilities in RageDB. The force graph library expects an object with two arrays. One for nodes and one for links. Since we don’t know what the results are, we start with an empty graph and then iterate over the JSON results. If we encounter an array, we inspect it and call graphJSON recursively. If we get to a relationship, we add it to the links array, if we get to a node, we do the same:
function getViz(json) {
    return graphJSON(json, { nodes: [], links: [] });
}

const graphJSON = (obj = {}, res = {}) => {
    if(Array.isArray(obj)) {
        for (let index = 0, len = obj.length; index < len; ++index) {
            res = graphJSON(obj[index], res);
        }
    }
    if(typeof obj == 'object') {
        if(["starting_node_id", "ending_node_id", "type"].every(item => obj.hasOwnProperty(item))) {
            res.links.push(obj);
        } else if(["key", "id", "type"].every(item => obj.hasOwnProperty(item))) {
            res.nodes.push(obj);
        }
    }

    return res;
};
Now that we have our data property formatted, we need to pass it in. I’ve only just started using this library but it comes with a lot of customization options. For now we’ll add the properties of the node and relationship to the “nodeLabel” and “linkLabel” options so they show up on mouseOver.
            let vizWidth = responseViz.parentNode.parentElement.clientWidth - 50; // for padding
            const vizGraph = ForceGraph()(responseViz)
                .width(vizWidth)
                .height(600)
                .graphData(getViz(data))
                .centerAt(-200, -50)
                .zoom(4)
                .nodeId('id')
                .nodeLabel(node => JSON.stringify(node.properties, null, '\n'))
                .nodeAutoColorBy(node => node.id % 24)
                .linkLabel(rel => JSON.stringify(rel.properties, null, '\n'))
                .linkSource('starting_node_id')
                .linkTarget('ending_node_id')
                .linkDirectionalArrowLength(6)
                .linkDirectionalArrowRelPos(1)
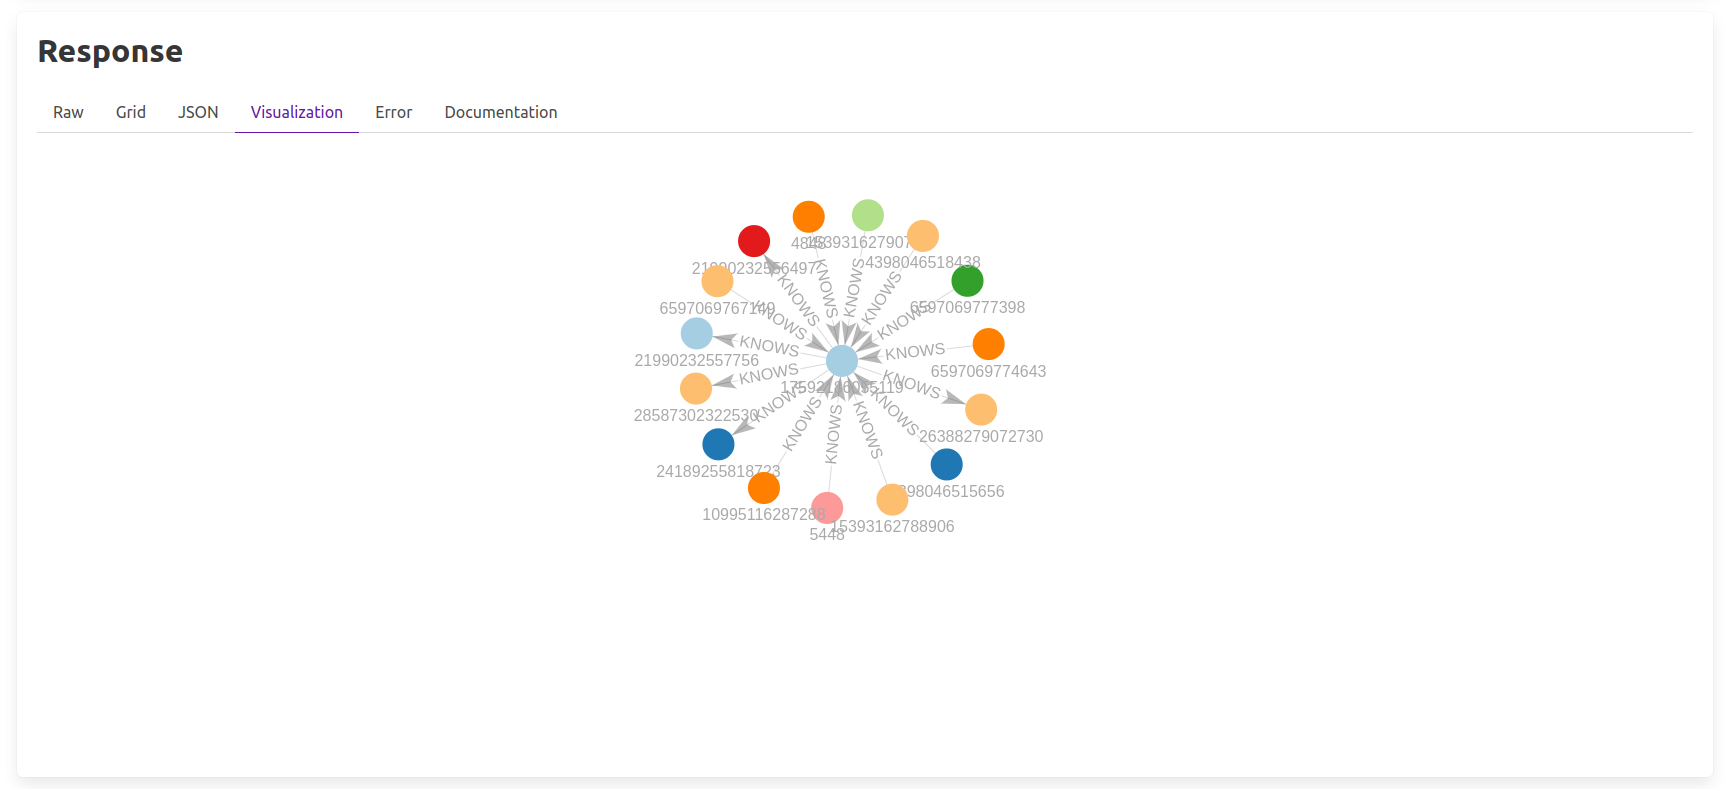
I’ll spare you the code, but I’ve also modified the node to show the “key” underneath and the link to show the relationship type. When it all comes together it looks like this:
I’m far from being a good front end developer, but with a little help from some well built open source libraries we can now start to really see the results. If you are a front end developer and want to help, please take a look at this horrific mess and then join our Slack.

Thanks, Max. Very informative.