Graph Generator

Update: Code to this project is available on Github.

In the US Air Guitar Championships, competitors use their talents to fret on an “invisible” guitar to rock a live crowd and deliver a performance that transcends the imitation of a real guitar and becomes an art form in and of itself. The key factor that determines the winner is having the elusive quality of “Airness“. When considering using Neo4j in a project, one of the key considerations is having a domain model that yields itself to a graph representation. In other words, does your data have “Graphiness“. However, it didn’t dawn on me until recently that when starting a proof of concept, you probably don’t have that data (or enough of it) or maybe your security guys won’t let you within 100 miles of the company production data with this newfangled nosql thingamajig.
Continue reading


Tagged , , ,

Batch Importer – Part 3

At the end of February, we took a look at Michael Hunger’s Batch Importer. It is a great tool to load millions of nodes and relationships into Neo4j quickly. The only thing it was missing was Indexing… I say was, because I just submitted a pull request to add this feature. Let’s go through how it was done so you get an idea of what the Neo4j Batch Import API looks like, and in the next blog post I’ll show you how to generate data to take advantage of it.
Continue reading

Tagged , , , ,

Personalization with Cypher

You hopefully have seen a TV commercial from “The Man Your Man Could Smell Like” marketing campaign put on by Old Spice, and you may have seen some of the over 100 videos Isaiah Mustafa appeared in responding to comments made on Twitter. This is a great example of personalization, and today you’ll learn how you can bring some personalization to your application, and you won’t need muscles or a horse.

We’re going to dust off the Neoflix project from the beginning of the year and add a few features. It has been updated to work on Neo4j version 1.7 and allows searching for movies that have a quote. Thanks to Jenn Alons and Vince Cima for the bug fixes during WindyCityDB.
Continue reading

Tagged , , ,

Key Players

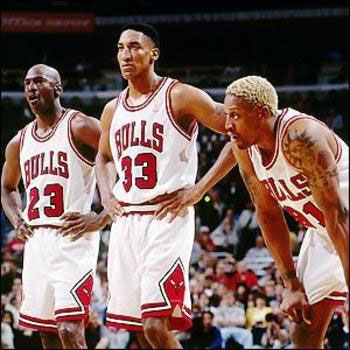
In the late 90s Michael Jordan, Scottie Pippen, and Dennis Rodman of the Chicago Bulls dominated the basketball court. They were the key players of the Chicago Bulls, and dominated the NBA offensively and defensively. When exploring a social network you’ll want to find who the key players are for a variety of reasons:

Disrupt: Who should be removed from the network to disrupt it?
Protect: Who should be protected in order to keep the network functioning?
Influence: Who should be influenced in order to change social opinion?
Learn: Who should be questioned in order to know what is going on?
Redirect: Who should be moved to alter social flows?
Continue reading

Tagged , ,

Relationships

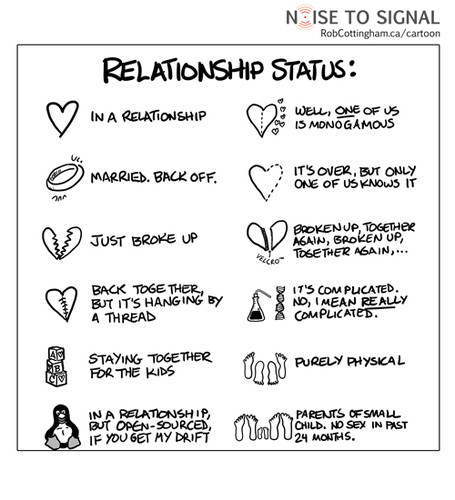
When working with relational databases, the join tables are sometimes treated as second class citizens. If they are lucky, they’ll get some additional fields, but are often just placeholder tables connecting your main object tables together. It leads you to think about objects first, and relationships second. With graphs, you will want to switch up your thinking. You want to start thinking about how things are connected. Think about the different ways things are connected. Two people can be friends, co-workers, and neighbors all at the same time.
Continue reading

Tagged ,

Slides from Chicago Graph Database April Meet-up

Thank you again to Groupon Engineering! They hosted our Graph Database Meet-up at their Headquarters.

Join us May 31st, 2012 for our next meet-up Add data from your existing Application into Neo4j.

Tagged , ,

Using Three.js with Neo4j

Last week we saw Sigma.js, and as promised here is a graph visualization with Three.js and Neo4j. Three.js is a lightweight 3D library, written by Mr. Doob and a small army of contributors.

The things you can do with Three.js are amazing, and my little demo here doesn’t give it justice, but nonetheless I’ll show you how to build it.
Continue reading

Tagged , , , , , ,

Using Sigma.js with Neo4j

I’ve done a few posts recently using D3.js and now I want to show you how to use two other great Javascript libraries to visualize your graphs. We’ll start with Sigma.js and soon I’ll do another post with Three.js.
Continue reading

Tagged , , , , , ,

Slides from Chicago Graph Database March Meet-up

Cypher

View more PowerPoint from Max De Marzi

Thank you very much to Groupon Engineering! They hosted our Graph Database Meet-up at their Headquarters.

Join us April 30th, 2012 for Neo4j Basics and an introduction to Gremlin.

Tagged , , ,

Visualizing a set of Hiveplots with Neo4j


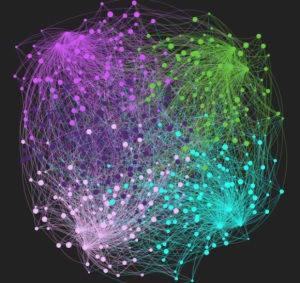
What should a graph look like and how can I tell two graphs apart?

Continue reading

Tagged , , , , , ,