How does the saying go? Opinions are like bellybuttons, everybody’s got one? So let’s say you have an opinion that NOSQL is not for you. Maybe you read my blog and think this Graph Database stuff is great for recommendation engines and path finding and maybe some other stuff, but you got really hard problems and it can’t help you.
I am going to try to show you that a graph database can help you solve your really hard problems if you can frame your problem in terms of a graph. Did I say “you”? I meant anybody, specially Ph.D. students. One trick is to search for “graph based approach to” and your problem.
I’ll give you an example. The other day I ran in to “Opinosis: A Graph Based Approach to Abstractive Summarization of Highly Redundant Opinions” by Kavita Ganesan, ChengXiang Zhai and Jiawei Han at the University of Illinois at Urbana-Champaign. Here is the abstract:
We present a novel graph-based summarization framework (Opinosis) that generates concise abstractive summaries of highly redundant opinions. Evaluation results on summarizing user reviews show that Opinosis summaries have better agreement with human summaries compared to the baseline extractive method. The summaries are readable, reasonably well-formed and are informative enough to convey the major opinions.
What does that mean? It means Opiniosis takes the free form text people write in reviews, aggregates it, and makes something useful out of it, so I can look at one sentence and not 1000 when looking for details about a review.
How is this useful? Most companies want to know what their customers are saying about them, but nobody has time to read 1000 responses to that customer survey, so generate a summary instead. Ebay feedback? Twitter posts about a specific hashtag? Text of support e-mails? You get the picture.
Let’s dive into what this means by an example that everyone is familiar with, e-commerce.

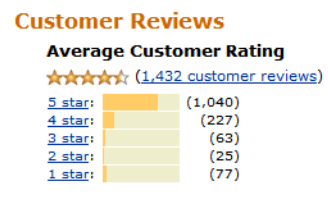
You can see the 1 to 5 star ratings and you already know how to build a recommendation algorithm out of this. We also know how to predict what the star rating of the user will be using personalization, but we want to ask a different question. Can we summarize what people are saying about this product? We want to do this because all our competitors are also giving items 1-5 star ratings, and they are also telling you what rating they think you’ll give this item. But it’s not enough. We turned to graph databases to get that little bit extra. That feature that none of our competitors are doing, that secret sauce, that edge.
We are going to take the things people are saying about the products we sell and generate a graph out of them, find the paths most traveled, and combine them to build our summary. An illustration might help:

Today we are just going to look at Step 1. Our input is going to be these two sentences:
My phone calls drop frequently with the iPhone.
Great device, but the calls drop too frequently.
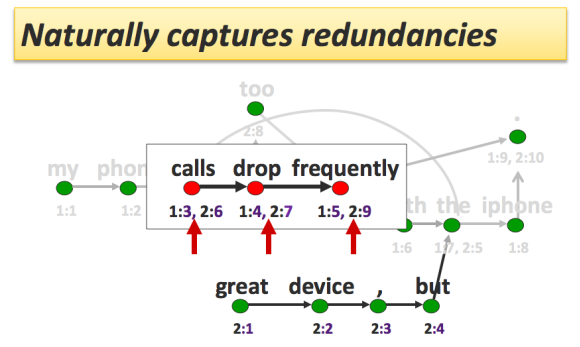
With these, we can generate the following graph:

One interesting property about this graph is that it naturally captures redundancies. The paths shared by 2 sentences are captured by the nodes which is what allows us to have high confidence in the summaries we build.

Another property the graph has is that it can handle gaps between words, which helps us see the redundancy and allows us to discover new sentences.

A third interesting property about this graph is that it allows us to join similar sentences together:

Think about how these properties are going to help us build a summary that represents what our users are saying, and we’ll tackle building the graph in part 2.
If you want to take a sneak peek, take a look at the Opinosis presentation which goes over each step in depth. You can find more about it on Kavita’s website.
Interesting, but how can this representation handle context/sentiment?
For example if an opinion in the form of “my phone calls DO NOT drop frequently” is added, will it be aggregated with the negative ones or positive/neutral ones?
Sentiment is not included in this context. Part of speech is taken into account, but for your specific question, the number of redundant entries will determine the winning summary. For your example, the number of people who wrote “calls drop frequently” vs “calls do not drop frequently” determines the “winning” opinion.
Are there any research papers that you can reference to that describe/support this approach?
Sorry, found it at the beginning of your post, read to fast :\ Thanks
This was awesome! When’s part 2 coming out?
Should have been a month ago… I need to clone myself so I can handle the work and still blog. I’ll try to get it finished and published soon.
{sad face} Still no part 2. Very interesting topic
[…] was really impressed by this blog post on Summarizing Opinions with a Graph from Max and always waited for Part 2 to show up […]
[…] was really impressed by this blog post on Summarizing Opinions with a Graph from Max and always waited for Part 2 to show […]
[…] a graph of conversations as my colleagues Max and Michael have previously blogged […]
[…] posted on Michael’s Blog I was really impressed by this blog post on Summarizing Opinions with a Graph from Max and always waited for Part 2 to show up The blog post explains a really interesting […]